Figures & data
Table 1 Comparison of sPD-1 According to Clinical Characteristics of HCC Patients
Figure 1 Comparison of the initial sPD-1 levels between HCC patients and normal controls. A significant difference was observed between the two groups (P = 0.031).
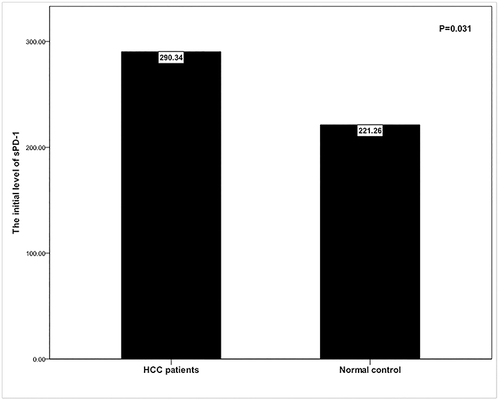
Figure 2 Comparison of the initial sPD-L1 levels among different BCLC staging categories. No significant differences were detected (P = 0.551).
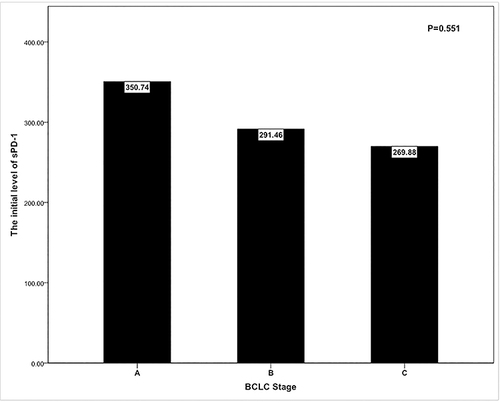
Figure 3 Fluctuation of sPD-1 levels in seven HCC patients during the course of D-TACE treatment. The sPD-1 level on 3 days post-D-TACE was lower than that before D-TACE (P = 0.032), and the sPD-1 level on 30 days post-D-TACE was higher than that on 3 and 7 days post-D-TACE (P = 0.039, P = 0.002). However, there were no significant differences between sPD-1 levels on 3 and 7 days post-D-TACE (P = 0.541) and between 1 day before D-TACE and 30 days after D-TACE (P = 0.920).
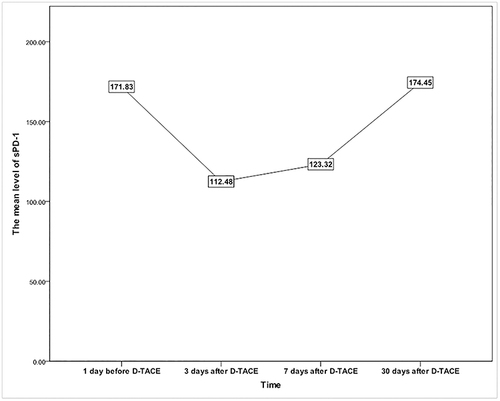
Figure 4 Comparison of sPD-1 levels on 3 days after D-TACE between 100–300µm and 300–500µm Callispheres beads. No significant differences were observed (P = 0.914).
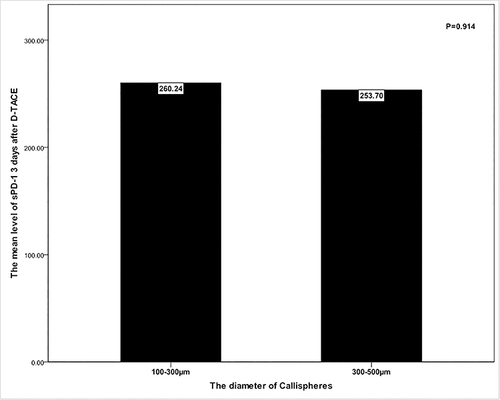
Figure 5 Comparison of sPD-1 levels on 7 days after D-TACE between 100–300µm and 300–500µm Callispheres beads. The results showed significant differences (P = 0.017).
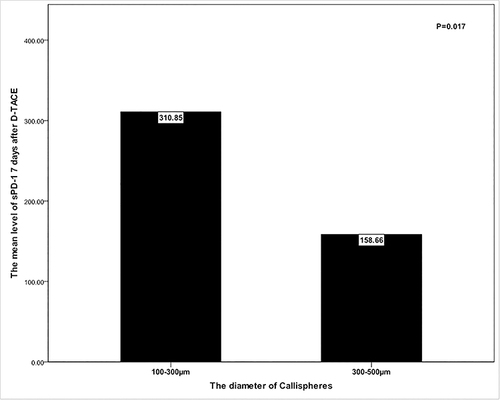
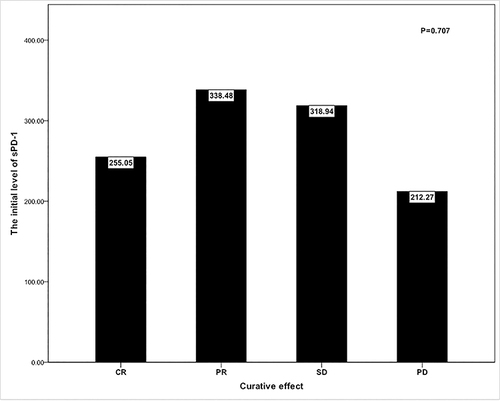
Figure 6 Comparison of the initial sPD-1 levels among different curative effect groups 30 days after D-TACE based on mRECIST criteria. No significant differences were found (P = 0.707).