Figures & data
Table 1 Patient Baseline Characteristics
Figure 1 Flowchart of the recruitment process. aPTV 50 Gy in 25 fractions, five consecutive days per week; bPTV 15–24 Gy in 3 fractions, three consecutive days; cPTV 18 Gy/6 fractions, or 45 Gy/3 fractions.
Abbreviations: ICC, intrahepatic cholangiocarcinoma; cHCC-CCA, combined hepatocellular-cholangiocarcinoma; HCC, hepatocellular carcinoma; TT, targeted therapy; TACE, transarterial chemoembolization; LDRT, low-dose radiotherapy; SBRT, stereotactic body radiation therapy; PTV, planning target volume; PGTV, planning gross tumor volume.
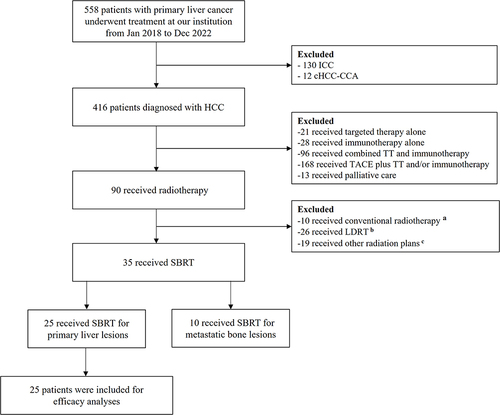
Table 2 Uni- and Multivariate Analyses for PFS
Figure 2 Kaplan–Meier curves for PFS (A), and stratified by LCR (B).
Abbreviations: PFS, progression-free survival; LCR, lymphocyte‐to-C reactive protein ratio.
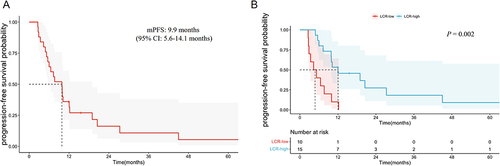
Table 3 Uni- and Multivariate Analyses for OS
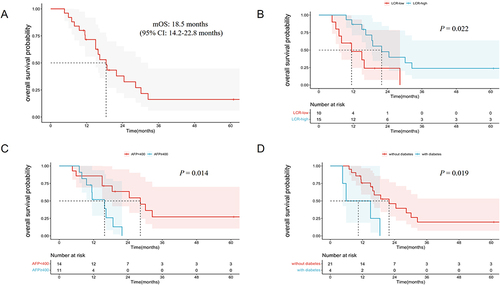
Figure 3 Kaplan–Meier curves for OS (A), and stratified by LCR (B), AFP (C), and diabetes (D).
Abbreviations: OS, overall survival; LCR, lymphocyte‐to-C reactive protein ratio; AFP, alpha-fetoprotein.