Figures & data
Table 1 Comparison of Variables Between HBOL Cohort and HMOL Cohort
Figure 1 Flow chart of the study process.
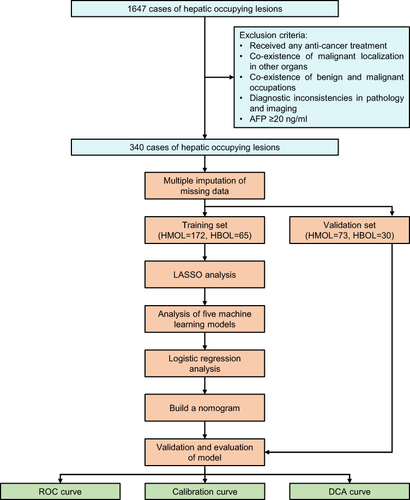
Figure 2 Results of the LASSO regression and machine learning analyses for predicting hepatic malignant occupying lesions (HMOL). (A) Plot of the LASSO coefficient profiles. (B) The tuning parameter (λ) was selected based on the 10-fold cross-validation error. Two vertical lines mark the selection point, with the right line indicating the selection of six candidates with non-zero coefficients at a mean error of one standard error (λ=0.061). These candidates include gender, age, log10(des-gamma-carboxy-prothrombin) (DCP), serum ferritin (SF), log10(alpha-fetoprotein) (AFP), and hepatitis B surface antigen (HBsAg). (C) ROC curve of five machine learning models used to predict HMOL.
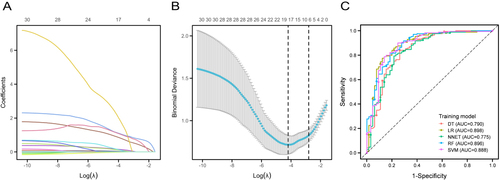
Table 2 Results of Logistic Regression Analysis
Figure 3 Nomogram prediction model for the diagnosis of liver malignant tumors. The model was established in the training set using six parameters: gender, age, log10(des-gamma-carboxy prothrombin) (DCP), serum ferritin (SF), log10(alpha-fetoprotein) (AFP), and hepatitis B surface antigen (HBsAg). The red points on the nomogram represent a case, involving a 71-year-old male with DCP at 1.780 log10 ng/mL, SF at 290 μg/L, AFP at 0.462 log10 ng/mL, and the HBsAg at 0 IU/mL. Utilizing the GADSAH model, the total score for this patient was calculated as 0.681, corresponding to an 85.8% probability of diagnosing hepatic malignant occupying lesions (HMOL). *p<0.05, **p<0.01, ***p<0.001.
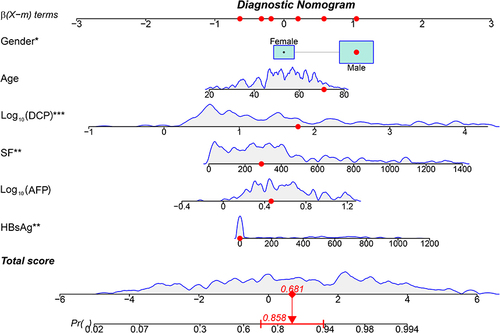
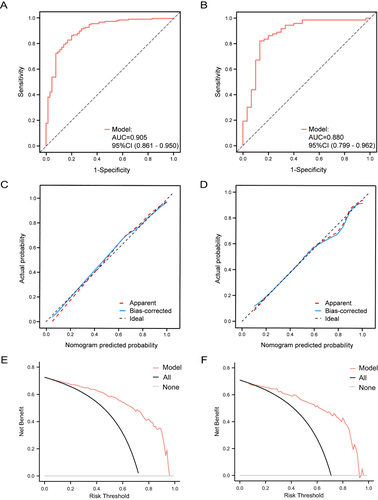
Figure 4 Assessment of discrimination, credibility, and benefit of the nomogram model. The figure includes ROC curves for the model in both the training set (A) and validation set (B), calibration curves for both the training set (C) and validation set (D), and decision curve analysis for both the training set (E) and validation set (F).