
Figures & data
Table 1 Demographic Data and Clinical Characteristics of Patients of Hepatocellular Carcinoma with Portal Vein Tumor Thrombus
Table 2 Univariable and Multivariable Cox Hazards Analysis of the Training Cohort
Figure 1 Visualization of elastic-net regression screening indicators and nomogram for predicting HCC patient with PVTT prognosis. (a) Elastic-net coefficient profiles of the 26 risk factors. (b) 10 risk factors selected using Elastic-net Cox regression analysis. The two dotted vertical lines were drawn at the optimal scores by minimum criteria(left) and 1-s.e. criteria(right) (At minimum criteria including: tumor number, tumor size, treatment, WBC, Hgb, PLT, BUN, ALT, AST, TBIL, ALB, γ-GGT, PTA, AFP, MPV, PCT, P-LCR, PDW, T cells/Lymphocytes, CD8+T cells counts, CD4+T cells counts). (c) Nomogram for predicting the 1, 3, 5-year-Overall Survival probability in HCC patient with PVTT. When using the nomogram, find the position of each variable on the axis and the corresponding point vertically. Then, add the points of all variables, and determine the prediction probability of OS in different 3 years on the bottom axis. The green represents categorical variables and the red represents continuous variables, and the filled portion represents the data distribution for constructing the nomogram model. The symbol “*” represents the significance of the p-value, that is, “*” indicates p=0.033, “**” indicates p=0.008, and “***” indicates ≤0.001.
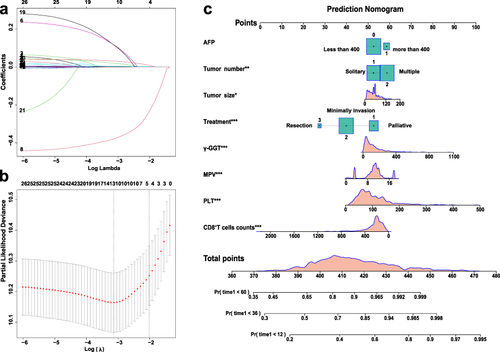
Figure 2 Performance of Nomogram model in predicting the outcome of HCC patient with PVTT. (a) ROC analysis of 1-year, 3-year, and 5-year PFS; (b and c) ROC analysis of 1-year, 3 years OS; (d) Calibration curve for predicting 1-year,3-year, and 5-year OS in the training cohort. (e) ROC analysis of 1-year, 3-year, and 5-year PFS; (f and g) ROC analysis of 1-year, 3 years OS; (h) Calibration curve for predicting 1-year,3-year, and 5-year OS in the validation cohort. (i and j) DCA for predicting 1-year,3-year, and 5-year OS and 1-year OS compared with different models in the training cohort. (k and l) DCA for predicting 1-year,3-year, and 5-year OS and 1-year OS compared with different models in the validation cohort.
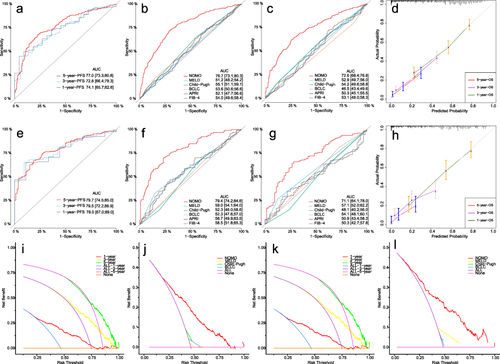
Figure 3 Risk stratification survival analysis of HCC patient with PVTT divided by nomogram model. (a–d) Kaplan–Meier survival curves of OS and PFS in training and validation cohort; (e–g) Comparison of Kaplan–Meier OS curves between the high-risk, median risk and low-risk score subgroups in subpopulations with Child–Pugh A, B, or C stage; (h and i) BCLC stage C or D stage, (j and k) solitary or multiple tumors, (l and m) tumor size ≤50mm or >50mm, (n and o) AFP≤400ng/mL or >400ng/mL, (p–r) Palliative, Minimally invasive or Resection.
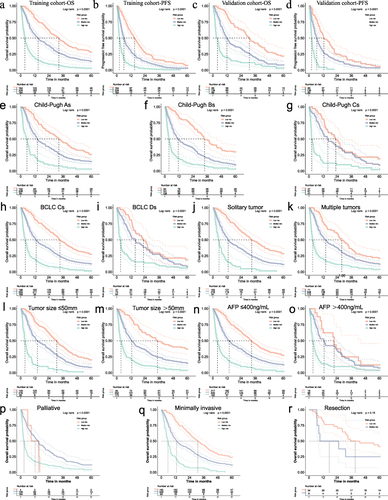
Figure 4 Correlation analysis of indicators included in nomogram model. (a) Heat map reflecting the correlation of indicators. The larger the absolute value of the number, the stronger the positive or negative correlation; (b–d) Scatter plot displaying the 3 pairs of parameters with the strongest correlation: PLT-CD8+T cells counts, PLT–γ-GGT and PLT–Tumor size; (e and f) Percent Stacked Column Chart displaying the distribution of PT-8 indicators among different risk groups among all patients, as well as the proportion of PT-8 indicators among different risk groups; (g) Kaplan–Meier OS curves in subgroups of combination of PLT (<100*10^9/L vs. ≥100*10^9/L) and CD8+T cells counts (<320 cells/μL vs. ≥ 320 cells/μL). LP-HT, Low PLT and High CD8+Ts; LP-LT/ HP-HT, Low PLT and Low CD8+Ts/ High PLT and High CD8+Ts; HP-LT, High PLT and Low CD8+Ts.
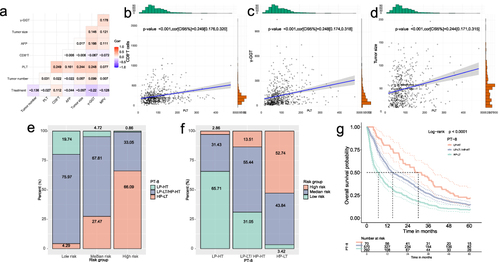
Figure 5 Comparison of survival distribution by the risk score and PLT-CD8+T cells counts in different subpopulations. (a) Sankey diagram displaying the relationship between different risk subgroups, PLT-CD8+T cells counts subgroups and 3-year outcome; (b) The rose plot displaying the distribution of PT-8 indicators in all patients and subgroups with tumor size>50mm, multiple tumors, Child Pugh C stage, BCLC D stage, and AFP>400ng/mL. (c–e) Comparison of Kaplan–Meier OS curves between patients with different PT-8 metrics at Child-Pugh A, B, or C stage, (f and g) BCLC C or D stage, (h and i) AFP ≤400ng/mL or >400ng/mL, and (j–l) Palliative, Minimally invasive or Resection. LP-HT, Low PLT and High CD8+Ts; LP-LT/ HP-HT, Low PLT and Low CD8+Ts/ High PLT and High CD8+Ts; HP-LT, High PLT and Low CD8+Ts.
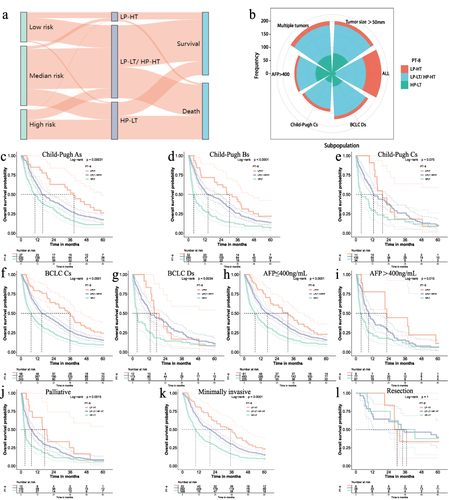
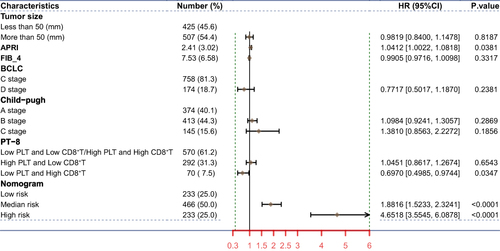
Figure 6 Forest map comparing mortality risk in overall survival. PT-8, indicators of binding of different levels of platelets and CD8+T cells counts.
Data Sharing Statement
The datasets used or analyzed during the current study are available from the corresponding author on reasonable request.