Figures & data
Table 1 mRNA Gene Primer Sequences
Figure 1 (A) Schematics of liver cancer metastasis mouse model. (B) Fluorescence imaging of experimental groups and fluorescence intensity comparison. (C) Liver fluorescence imaging for experimental groups and fluorescence intensity comparison. (D) Liver imaging and quantification of liver nodules in situ. (E) Liver hematoxylin and eosin (H&E) staining. (F) Lung fluorescence imaging and fluorescence intensity comparison. (G) Lung imaging and quantification of pulmonary nodules. (H) Lung H&E staining. **P < 0.01, ***P < 0.001 vs the control group.
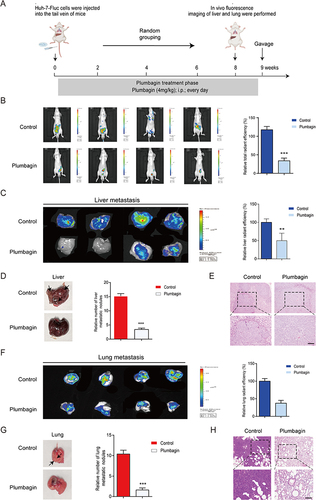
Figure 2 (A) Schematics of in situ liver cancer model development (B) Fluorescence imaging of experimental mice and comparison of fluorescence intensity. (C) Liver imaging and quantification of in situ liver nodules. (D) Liver hematoxylin and eosin (H&E) staining. (E) Lung fluorescence imaging and fluorescence intensity comparison. (F) Lung imaging and quantification of lung nodules. (G) Lung H&E staining. ***P < 0.001 vs the control group.
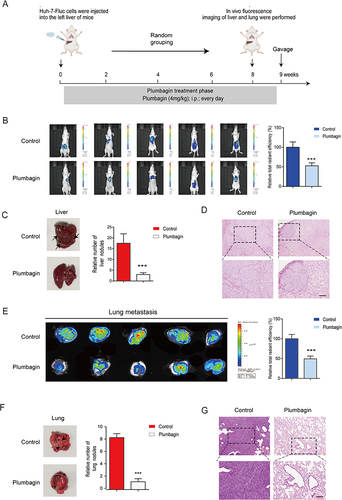
Figure 3 (A) Immunohistochemical (IHC) staining of liver tissue. (B) Quantitative expression of EMT-related proteins in liver tissue assessed using IHC. (C) Western blot detection of EMT-related protein bands in liver tissue. (D) Quantitative expression of EMT-related proteins in liver tissue. ***P < 0.001 vs the control group.
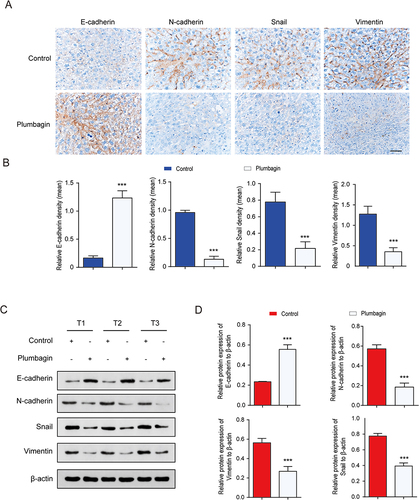
Figure 4 (A) The expression of E-cadherin and N-cadherin in cells determined by immunofluorescence staining. (B) Quantitative protein expression of E-cadherin and N-cadherin (C) Changes in Snail and vimentin cell expression levels measured by fluorescence staining. (D) Quantitative expression of Snail and vimentin proteins. In the image, DAPI stains the nucleus (blue). **P < 0.01, ***P < 0.001 vs tumor growth factor-β group; ###P < 0.001 vs blank group.
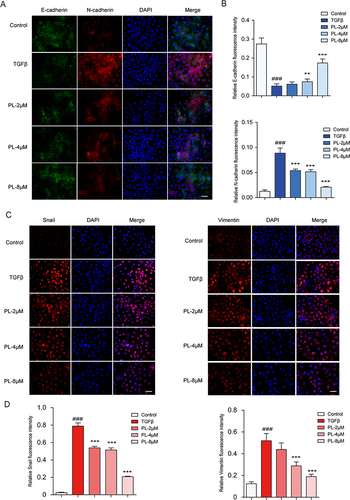
Figure 5 (A) mRNA levels of epithelial-mesenchymal transition (EMT) cell markers detected using quantitative polymerase chain reaction. (B) Protein bands corresponding to EMT cell markers detected using Western blot. (C) Quantitative assessment of EMT marker proteins. *P < 0.05, **P < 0.01, and ***P < 0.001 vs tumor growth factor-β group; ###P < 0.001 vs the control group.
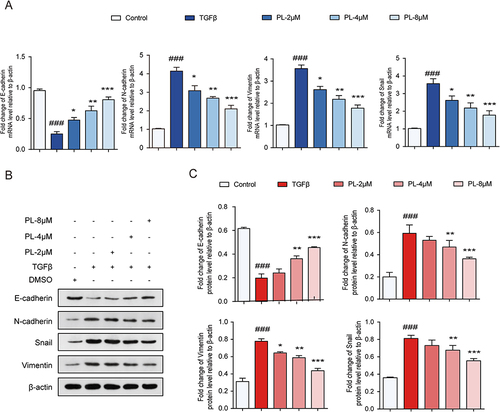
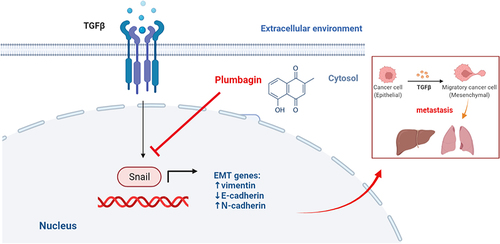
Figure 6 Mechanism of plumbagin-induced Snail and hepatocellular carcinoma epithelial-mesenchymal transition inhibition.