
Figures & data
Figure 1 The brief flowchart of this study.
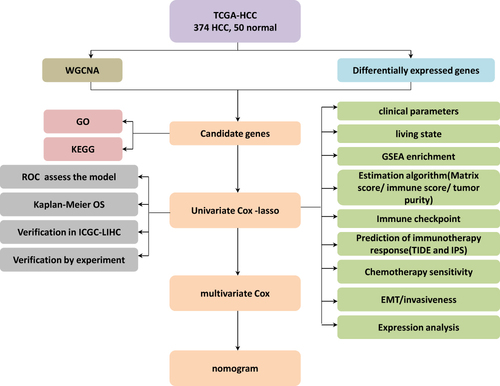
Figure 2 Identification of MPRGs score-related module genes (A) Sample clustering to detect the outliers in the TCGA-HCC dataset. The red line represents the height of the screening outliers. (B) Analyses of the appropriate soft threshold power and minimum mean connectivity to construct topological overlap matrix T(OM). (C) Clustering dendrograms of the co-expression network modules. (D) The correlation analysis between the TME score and module, correlation coefficient, and p-values are shown.
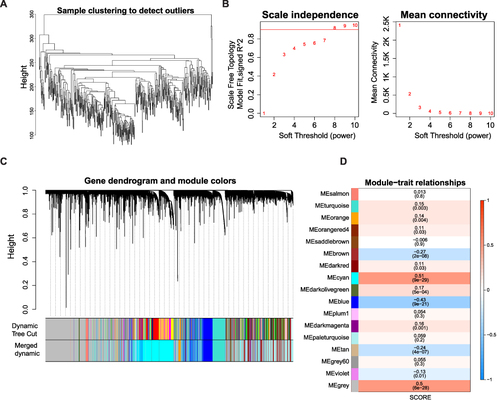
Figure 3 Identification of DEMPRGs and enrichment analysis (A) Volcano plot of DEGs between two clusters with different MP-related gene expression. The red and green points represent up- and down-regulated genes with statistical significance, respectively. (B) The bar plot of enriched Gene Ontology (GO) terms. BP indicates biological process, CC indicates cellular component, and MF indicates molecular function. The length of each column represents the count of genes; the shade of color represents the p value. (C) KEGG analysis of DEGs that were upregulated of DEGs.
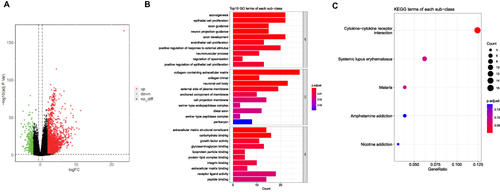
Table 1 Result of Univariate Cox Model
Table 2 Prognostic Genes Identified by Multivariate COX
Figure 4 Creation and validation of a MP-related risk model (A) Forest plot of the univariate Cox regression analysis showing the prognostic metabolic genes. Genes with HR < 1 have better overall survival outcomes, while genes with HR > 1 have worse overall survival outcomes. (B) Lasso regression. Finally, 12 MP-related genes were obtained. (C) Lasso filters variables. (D) Forest plot of HR of six genes. (E and F) Expression heat map, risk score distribution and survival status. (G) Survival curve of low and high risk subgroup. (H) Time-dependent ROC curves for the efficacy evaluation of the 6-gene MP-related signature. * P < 0.05, ** P ≤ 0.01.
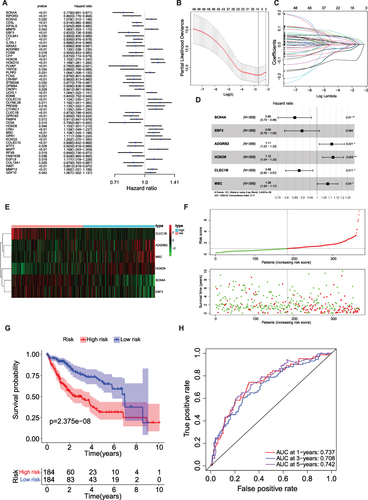
Figure 5 Clinical significance and independent prognostic analysis of the risk model (A) The correlation between risk score and patient parameters. (B) Risk score of different stages in HCC. (C) Forest maps of the univariate and multivariate Cox regression analysis, including risk score, grade, and stage. (D) ROC curves presented AUC value of risk score. (E) Nomogram based on risk score and clinical factors, including a prediction of 1-, 3-, and 5-year OS. (F) Calibration curves were predicted and observed 1-, 3-, and 5-year survival nomogram consistency.
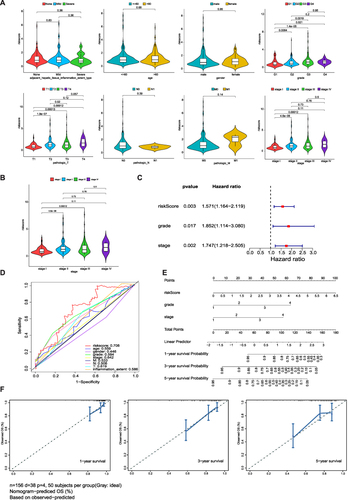
Table 3 Result of Independent Prognostic Univariate COX Analysis
Table 4 Result of Independent Prognostic Multivariate COX Analysis
Figure 6 GSEA analysis showing the enriched pathways of the high-and low-risk groups. (A) Left chart: Multiple GSEA showing enriched pathways in the high-risk group. Right chart: Multiple GSEA showing enriched pathways in the low-risk group. (B) Violin plots of stromal scores, immune scores and ESTIMATE scores between high and low risk groups. (C) The correlation between MPRGs and stromal scores, immune scores, ESTIMATE scores.* P < 0.05, ** P < 0.01.
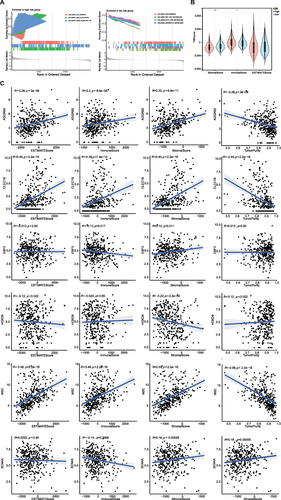
Figure 7 Correlation analysis of metastasis/invasion indicators in HCC. (A) The correlation between risk scores and invasion-related related genes. (B) The correlation between risk scores and EMT related genes. (C) The correlation between MPRGs and invasion score, EMT score. ** P < 0.01.
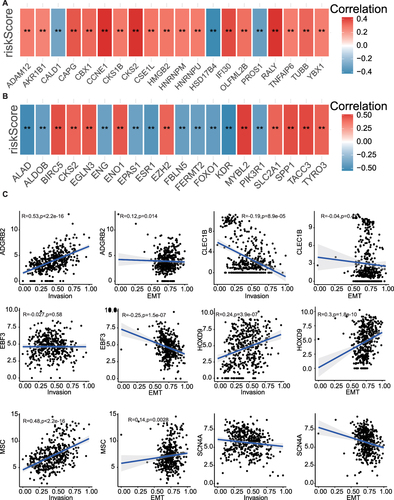
Figure 8 Immune checkpoint expressions and chemotherapy response in two risk subgroups (A) Immune checkpoint expressions in high risk group and low risk group. (B) IC50 value of chemotherapeutic drugs in high risk group and low risk group. ns=not significant, * P < 0.05, ** P < 0.01, *** P < 0.001, **** P < 0.0001.
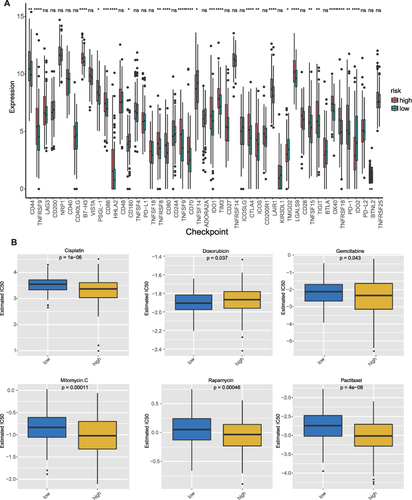
Figure 9 SCN4A is highly expressed in HCC tissues (A) MPRGs expressions in HCC of TCGA-HCC dataset. (B) qPCR result of SCN4A expressions in HCC of patients. (C) Representative IHC staining of SCN4A expressions in HCC of patients. Bars=100 μm. * P < 0.05, *** P < 0.001, **** P < 0.0001.
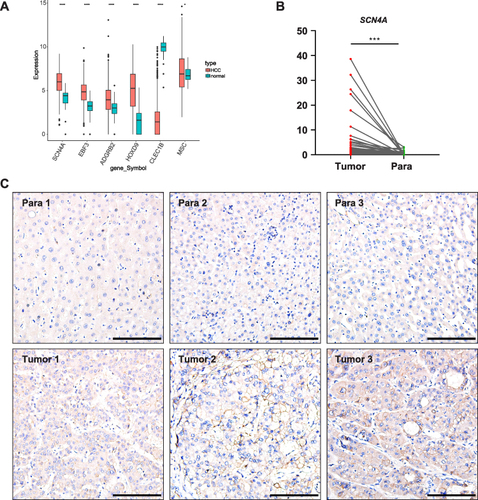
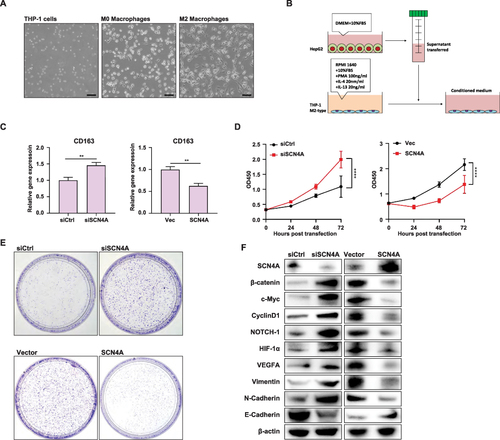
Figure 10 SCN4A expression in HCC cells could regulate M2 macrophage polarization in HCC tumor microenvironment and HCC progression (A) THP-1 cells were induced to differentiate into macrophages displaying M2 polarization by treatment with IL-4 (20 ng/mL) and IL-13 (20 ng/mL), in the presence of PMA (100 ng/mL). (B) Schematic of the indirect co-culture model. (C) qPCR result of CD163 expression in MP macrophages of the indirect co-culture model. (D) CCK-8 experiments showed the growth curve of HepG2 cells. (E) Colony formation assay showed the growth of HepG2 cells. (F)Western blot analysis of SCN4A, β-catenin, c-Myc, CyclinD1, NOTCH-1, HIF-1α, VEGFA, Vimentin, N-Cadherin and E-Cadherin in HepG2 cells. **** P < 0.0001.
Data Sharing Statement
Gene expression data described in this study were deposited in TCGA and GTE databases. Additional relevant data supporting the findings of this study are available from the corresponding authors upon request. The datasets used and materials in this study are available upon reasonable request.