Figures & data
Figure 1 Heterogeneity of hepatocytes in HCC tissues. (A) malignant hepatocyte clusters were identified; (B) 9 major malignant hepatocyte clusters were further determined; (C) The top 10 GO enrichment pathways of 9 malignant hepatocyte clusters; (D) The top 10 KEGG pathways of 9 malignant hepatocyte clusters.
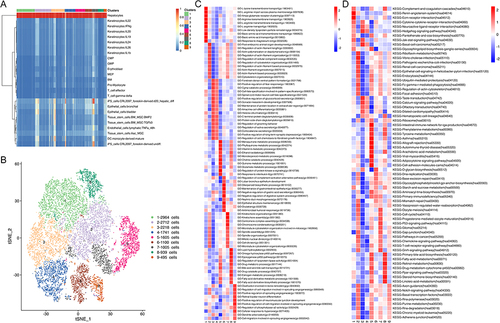
Figure 2 Landscape of differentially expressed genes associated with HCC metastasis. (A) Heatmap of top 10 DEGs between the metastasis and non-metastasis group in 9 malignant hepatocyte clusters; (B and C) Go enrichment analysis of total DEGs between the metastasis and non-metastasis group; (D and E) KEGG pathway analysis of total DEGs between the metastasis and non-metastasis group.
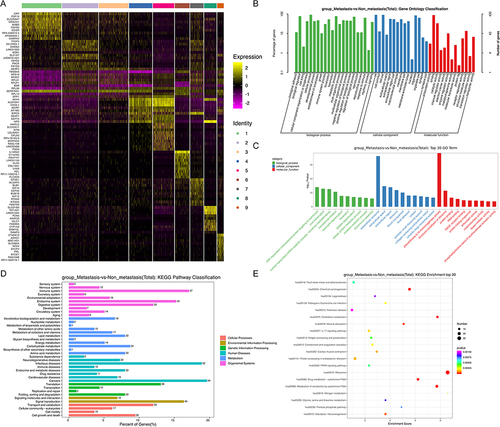
Figure 3 LOSSO regression analysis of DEGs associated with HCC metastasis and prognosis in the TCGA database. (A) The results of LASSO regression for the 15 DEGs; (B) Risk score of each HCC patient; (C) Patient survival based on the risk score; (D) Heatmap of the 15 DEGs in the low- and high-risk group; (E) Kaplan-Meier survival curves of OS for the patients in the low- and high-risk group; (F) ROC curves for the prognostic performance of the model for 1-, 3-, and 5-year OS.
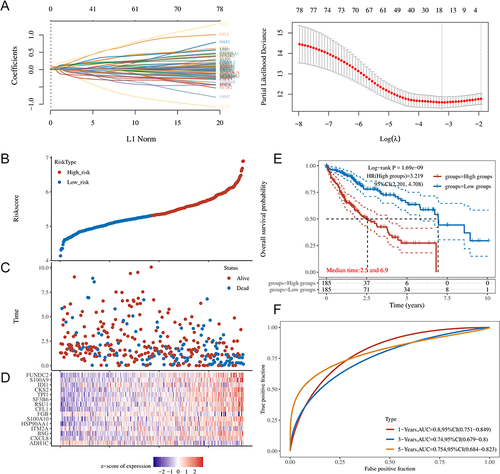
Figure 4 The correlation between TPI1 expression and clinicopathological data, prognosis, and immune cell infiltration in HCC patients. (A) The correlation between TPI1 expression and the clinicopathological data in the TCGA database; (B) The Kaplan-Meier survival curves of OS and DSS for the HCC patients with different TPI1 expression in the TCGA database; (C) Relationship between TPI1 expression and immune cell infiltration in the TCGA database; (D) Relationship between TPI1 expression and immune cell infiltration in the TIMER database; (E) Relationship between TPI1 expression and the expression of PDCD1 and CTLA4 in the TIMER database. *P < 0.05; **P < 0.01; ***P < 0.001.
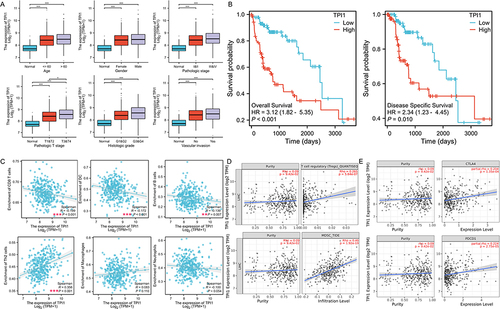
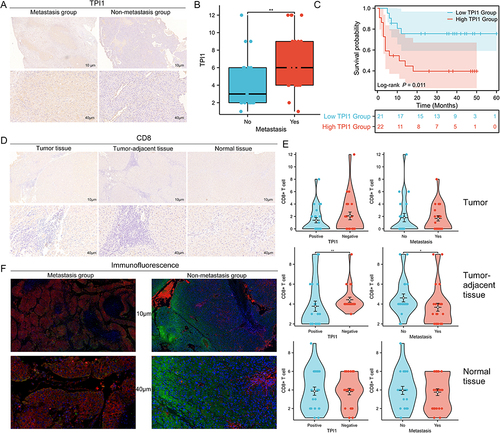
Figure 5 The expression of TPI1 and CD8 in HCC tissue samples. (A) Representative IHC staining of TPI1 in HCC tissues with and without metastasis; (B) The correlation between TPI1 expression and metastasis in HCC tissues; (C) The Kaplan-Meier survival curves of OS for HCC patients with different TPI1 expression; (D) Representative IHC staining of CD8 in HCC tissues and matched tumor-adjacent and normal tissue samples; (E) The correlation between the expression of CD8 and TPI1 expression and HCC metastasis in HCC tissue, matched tumor-adjacent tissue and normal tissue samples; (F) Representative IF images for TPI1 (red) and CD8 (green) staining in HCC tissues with and without metastasis. *P < 0.05; **P < 0.01.