Figures & data
Table 1 The Baseline Characteristics of All HCC Patients with MVI Among Different Type of Treatments Before and After PSM
Table 2 Univariate and Multivariate Analysis for DFS and OS in HCC Patients with MVI in Adjuvant Treatment and Control Group After PSM
Table 3 Risk Score Weight of Factors Which Were Significant in Multivariate Analysis
Figure 1 Flow chart of our study.
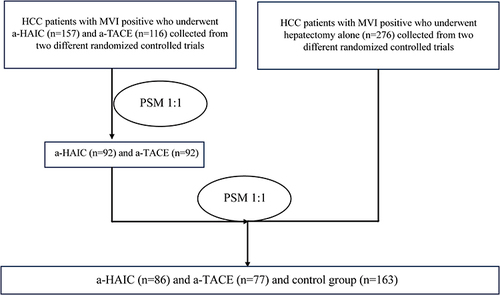
Figure 2 The Kaplan-Meier survival analysis of HCC patients DFS (A) and OS (B) before PSM between a-HAIC, a-TACE and control group.
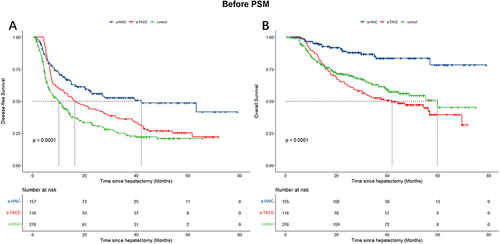
Figure 3 The Kaplan-Meier survival analysis of HCC patients DFS (A) and OS (B) after PSM between a-HAIC, a-TACE and control group.
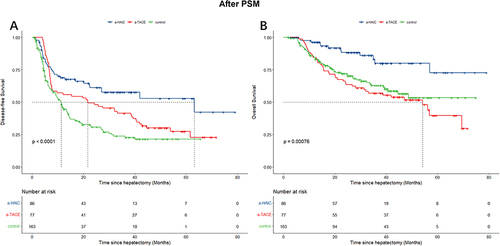
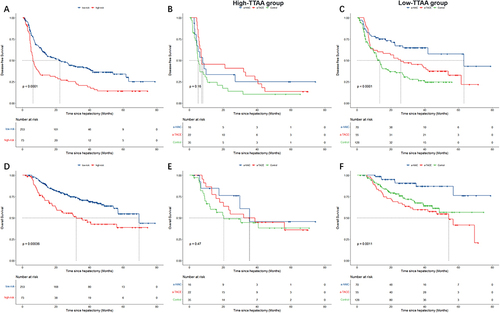
Figure 4 The Kaplan-Meier survival analysis for subgroups of HCC patients. (A) The Kaplan-Meier curves of DFS between high-TTAA group and low-TTAA group after PSM. (B) The Kaplan-Meier curves of DFS in the High-TTAA group between a-HAIC, a-TACE and control group. (C) The Kaplan-Meier curves of DFS in the Low-TTAA group between a-HAIC, a-TACE and control group. (D) The Kaplan-Meier curves of OS between high-TTAA group and low-TTAA group after PSM. (E) The Kaplan-Meier curves of OS in the High-TTAA group between a-HAIC, a-TACE and control group. (F) The Kaplan-Meier curves of OS in the Low-TTAA group between a-HAIC, a-TACE and control group.