
Figures & data
Figure 1 TTPVI and RVI are defined by a two- and three-trait tree-like decision model, respectively. TTPVI (upper row):Citation13 Index lesion must include the presence of intratumoral vessels in arterial contrast phase followed by the absence of a peritumoral hypointense halo in the portal venous contrast phase. RVI (lower row):Citation14 Index lesion must include the presence of intratumoral vessels in portal venous contrast phase, followed by the absence of a peritumoral hypointense halo in the portal venous contrast phase, and moreover, followed by the absence of a sharp tumor-liver-difference in the portal venous contrast phase. Arrows indicate the respective imaging trait. T indicated the tumoral index lesion.
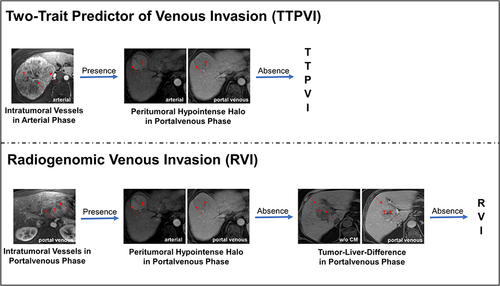
Table 1 Patients, Tumor and Disease Characteristics
Table 2 Response Assessment Evaluation by Modified Response Criteria in Solid Tumors
Figure 2 Patient survival and tumor progression with patients treated with ablation with and without prior embolization. Overall survival (OS), progression-free survival (PFS) and time-to-progression (TTP) are depicted for patients undergoing interstitial brachytherapy (iBT, green line) and conventional transarterial chemoembolization (cTACE, blue line). Kaplan–Meier analysis reveals no significant differences in survival outcomes between both patient groups. Median survival is indicated by dashed lines.
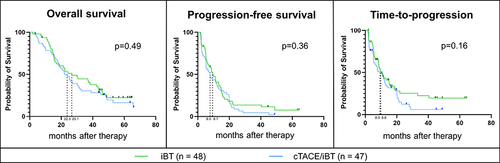
Table 3 The Impact of Radiogenomic Venous Invasion (RVI) and Two-Trait Predictor of Venous Invasion (TTPVI) on Survival Outcomes
Figure 3 The impact of RVI on patient survival and tumor progression in patients treated with ablation with and without prior embolization. Overall survival (OS), progression-free survival (PFS), and time-to-progression (TTP) are depicted for patients with a positive and negative RVI trait receiving interstitial brachytherapy (iBT, upper row) and iBT with a prior conventional transarterial chemoembolization (cTACE/iBT, lower row). For patients within the iBT group, Kaplan–Meier analysis reveals significantly poorer OS, PFS, and a trend for poorer TTP in patients that had a positive RVI trait. In patients within the cTACE/iBT group, no significant differences in survival outcomes were observed in regards of the RVI trait. Median survival is indicated by dashed lines.
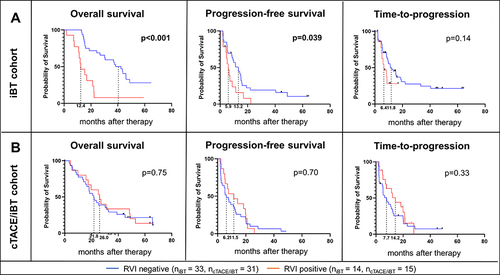
Figure 4 The impact of RVI and TTPVI imaging biomarkers and MVI trait in patients within the internal and external study cohorts. Hazard ratios (HR) and 95% confidence intervals (95%-CI) and p-values were calculated for the impact of RVI, TTPVI in the internal and external study cohorts as well and microvascular invasion (MVI) in the external study cohort and depicted as colored line graphs in the respective colors of the treatment groups: Orange – TCGA cohort, green – interstitial brachytherapy (iBT) cohort, and blue – conventional transarterial chemotherapy with consecutive iBT cohort (cTACE/iBT). Triangles show indicate a significant p-value for the respective Kaplan–Meier analysis (p<0.1).
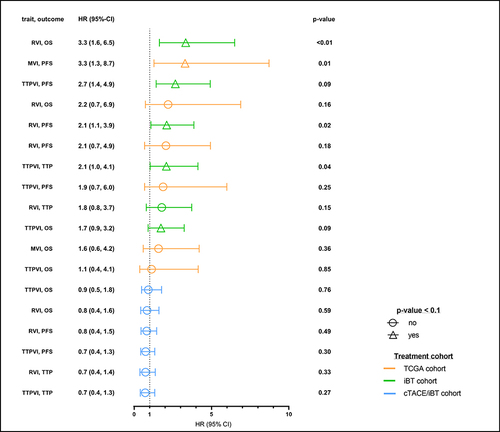
Table 4 The Confounding Effects of Clinical Parameters on the Survival Outcomes
Table 5 Correlation of Semantic Imaging Features with Radiogenomic Venous Invasion (RVI) and Two-Trait Predictor of Venous Invasion (TTPVI)
Data Sharing Statement
Additional data are available to readers upon reasonable request to the corresponding author.