
Figures & data
Figure 1 Patients selection.
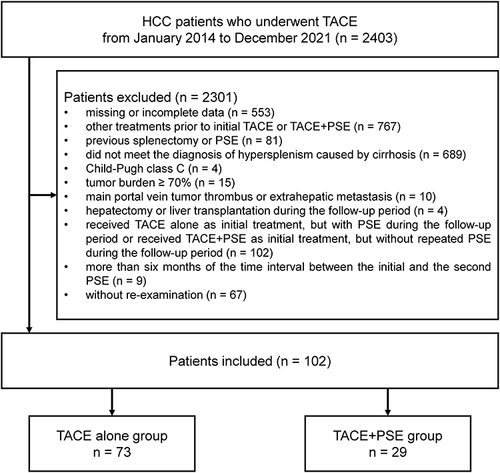
Table 1 Comparison of the Baseline Characteristics of Patients Between the TACE Alone Group and the TACE+PSE Group
Table 2 Comparison of the Changes in Peripheral Blood Cell Counts from Baseline Between the TACE Alone Group and the TACE+PSE Group
Figure 2 Changes in peripheral blood cell counts in two groups during the follow-up period. (A) Changes in PLT (platelet) from baseline; (B) Changes in RBC (red blood cell) from baseline; (C) Changes in hemoglobin from baseline; (D) Changes in WBC (white blood cell) from baseline. The blue points and lines indicate TACE alone group, and the red points and lines indicate TACE+PSE group. Data are presented as means ± standard deviations. *P < 0.05; **P < 0.01; ***P < 0.001.
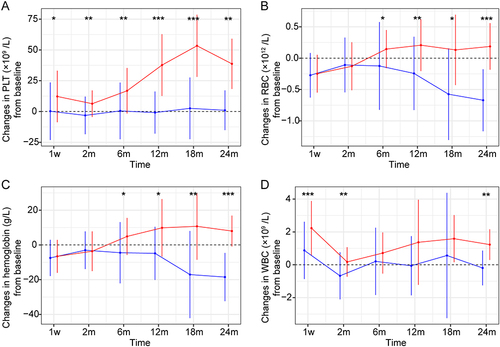
Table 3 Comparison Between Initial and Repeated PSE of the Changes in Peripheral Blood Cell Counts and Hepatic Function in 1 Week and 2–3 Months
Table 4 Comparison of the Changes in Hepatic Function from Baseline Between the TACE Alone Group and the TACE+PSE Group
Figure 3 Changes in hepatic function in two groups during the follow-up period. (A) Changes in Child-Pugh score from baseline; (B) Changes in total bilirubin from baseline; (C) Changes in albumin from baseline; (D) Changes in log ALT (alanine aminotransferase) from baseline; (E) Changes in log AST (aspartate aminotransferase) from baseline. The blue points and lines indicate TACE alone group, and the red points and lines indicate TACE+PSE group. Data are presented as means ± standard deviations. *P < 0.05; **P < 0.01.
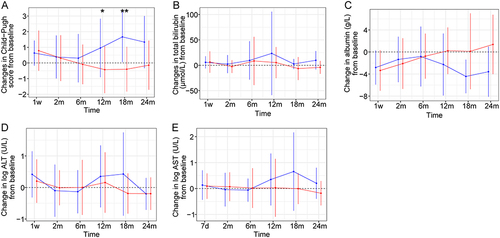
Figure 4 Mean number of TACE procedure sessions per patient during the follow-up period. *P < 0.05; **P < 0.01; ns: no significance.
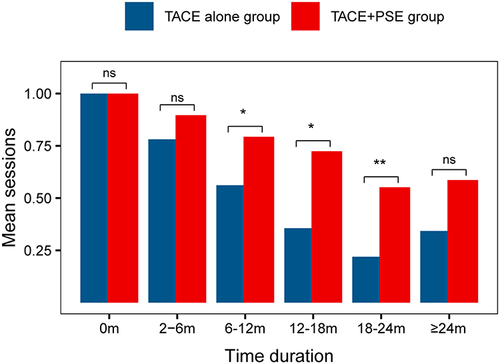
Table 5 Univariate and Multivariate Analysis on Baseline Factors Associated with Progression-Free Survival
Figure 5 Kaplan–Meier curves of the progression-free survival times.
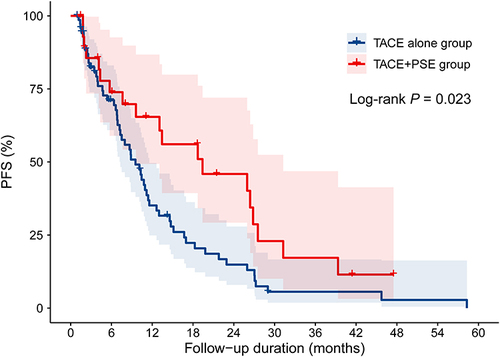
Table 6 Comparison of the Incidence of Complications After Initial TACE Alone Procedures, Initial TACE+PSE Procedures and Repeated TACE+PSE Procedures
Data Sharing Statement
The data are available from the corresponding author upon reasonable request.