
Figures & data
Table 1 Baseline Patient Clinicopathological Characteristics
Table 2 Univariate and Multivariate Cox Regression Analyses of Risk Factors Associated with Progression-Free Survival (PFS) After Surgery in the Total Cohort
Figure 1 Kaplan–Meier curves of PFS for patients with different NER groups. (A) Kaplan–Meier curves of PFS for patients with different NER groups in the total cohort. (B–E) Kaplan-Meier curves of PFS in different NER groups in patients negative for microvascular invasion (B), alpha-fetoprotein (AFP) ≤400 (C), Tumor diameter ≤4.5cm (D), single tumor (E).
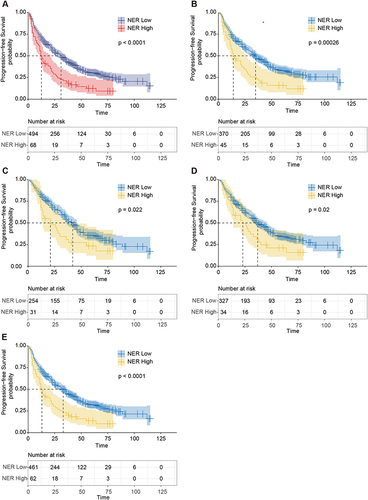
Table 3 The Clinicopathologic Characteristics of Patients in the Training and Validation Cohorts
Figure 2 The computational framework for machine learning algorithms. (A) A combination of 101 machine learning algorithms was generated by synthesizing the computational framework. The C-index of each model was calculated through the training and validation cohorts and sorted by the average C-index. (B) Prediction error rates. (C) Ranking of variable importance (VIMP) of features. (D–E) ROC curve and AUC of the RSF model in the training cohort (D) and validation cohort (E).
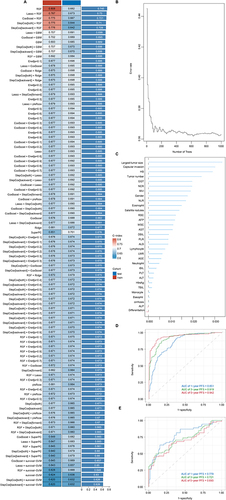
Figure 3 The calibration curves and the DCA curves of the model. (A and B) The calibration curves in the training cohort (A) and validation cohort (B). (C–H) The DCA curves in the training cohort (C–E) and validation cohort (F–H).
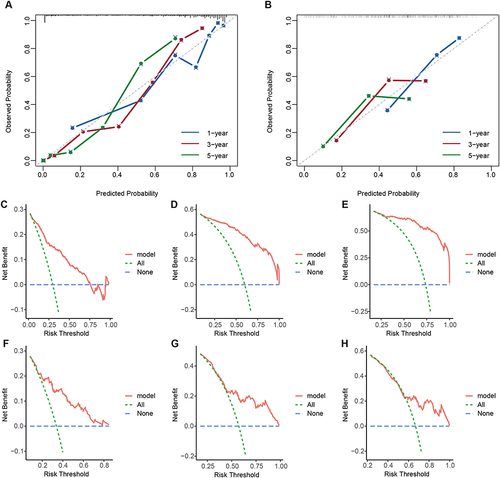
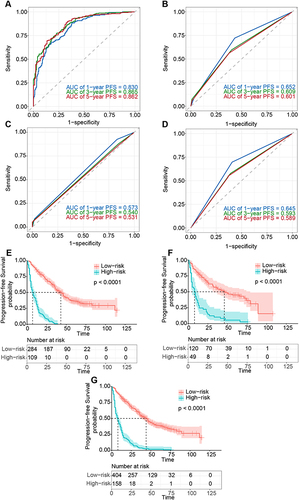
Figure 4 Receiver operating characteristic (ROC) curves and Kaplan–Meier curves of the model. (A–D) ROC curve and AUC of the RSF model (A), TNM staging system (B), BCLC staging system (C), and CNLC staging system (D) in the total cohort. (E–G) Kaplan–Meier curve of PFS in the total cohort (E), training cohort (F), and validation cohort (G).
Data Sharing Statement
The datasets used during the present study are available from the corresponding author, Dr. Peng Sun (email: [email protected]), upon reasonable request.