
Figures & data
Table 1 Baseline Characteristics of the AIT Group Compared with the at Group Before and After PSM
Figure 1 Flowchart of patients’ enrollment for comparison.
Abbreviation: PSM, propensity score matching.
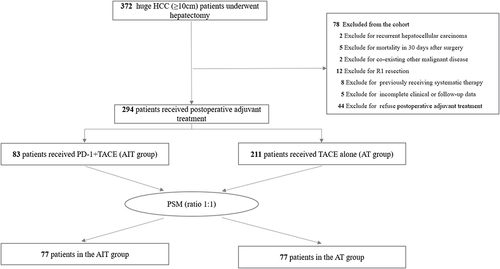
Table 2 Recurrence and Survival Data Before and After PSM
Figure 2 Comparison of RFS (A) and OS (B) between the AIT group and AT group after PSM.
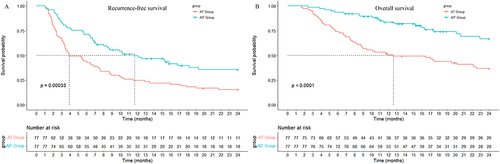
Table 3 Adverse Events in Regard to Immunotherapy
Table 4 Univariate and Multivariate Analysis of RFS and OS for Huge HCC After PSM
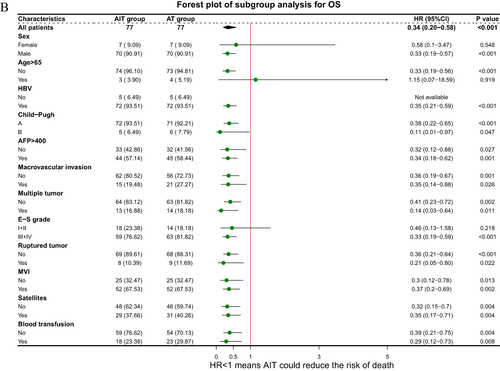
Figure 3 Continued.
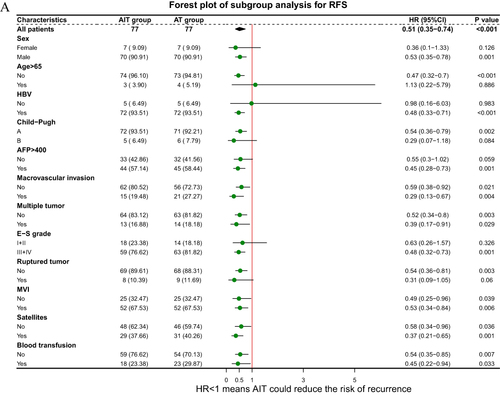
Figure 3 Forest plot for subgroup survival analysis for RFS (A) and OS (B).
Abbreviations: AFP, alpha-fetoprotein; E-S, Edmonson-Steiner; MVI, microvascular invasion.
Data Sharing Statement
The data that support the findings of this study are not publicly available due to privacy or ethical restrictions but are available on request from the corresponding author.