
Figures & data
Table 1 Baseline Characteristics of the Patients with HCC Who Received TACE and HAIC Therapy Before and After PSM
Figure 1 Enrollment pathway of patients with high-risk hepatocellular carcinoma(hHCC) who underwent HAIC and TACE therapy. *High risk: patients with Vp4 portal vein tumor thrombosis (PVTT), bile duct invasion, or a tumor infiltration volume of more than 50%.
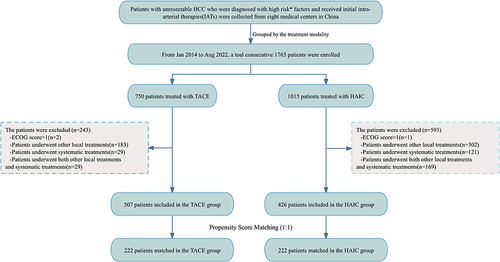
Figure 2 Comparison of survival between patients who received HAIC and TACE. Kaplan–Meier curves for the progression-free survival(PFS) and overall survival(OS) before and after propensity score matching (PSM).PFS before PSM (a), OS before PSM (b); PFS after PSM (c), OS after PSM (d).
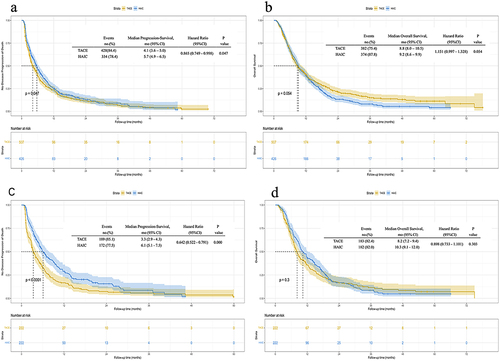
Table 2 Summary of Best Overall Response Before and After PSM
Table 3 Univariate and Multivariate Analysis of Risk Factors for Progression-Free Survival and Overall Survival After Matching
Figure 3 Forest plot showing the subgroup analysis of progression-free survival (a) and overall survival (b).
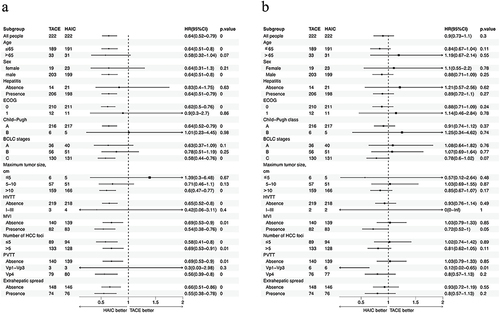
Table 4 Treatment-Related Adverse Events