
Figures & data
Figure 1 Patient flowchart of the study population.
Abbreviations: AMC, Asan Medical Center; HCC, hepatocellular carcinoma; KPLCR, Korean Primary Liver Cancer Registry.
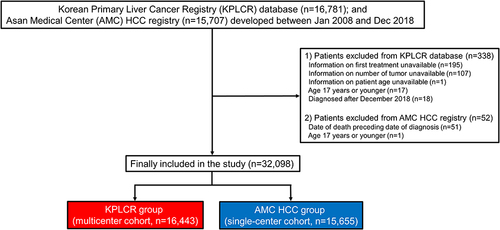
Table 1 Baseline Characteristics of the Study Populationsa
Table 2 Cox Regression Analysis of Factors Associated with Mortality in the Entire Cohortsa
Figure 2 Kaplan–Meier estimates of overall survival in the two cohorts.
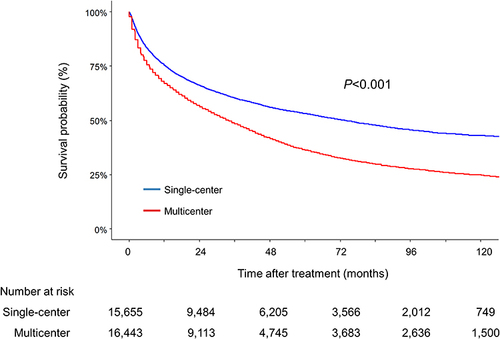
Table 3 Cox Regression Analysis of Risk of Mortality by Initial Treatment in the Entire Cohortsa
Table 4 Cox Regression Analysis of Risk of Mortality by Initial Treatment in BCLC-Guided Subcohortsa
Figure 3 Kaplan–Meier estimates of overall survival of patients who received (A) surgical resection, (B) liver transplants, (C) LAT, (D) TACE, and (E) systemic therapy according to the treatment indications*.
Notes: *Treatment indications: patients of BCLC stage 0 or A, single tumor: surgical resection, BCLC stage A with 3 or less nodules each up to 3 cm: LAT, BCLC stage B: TACE, BCLC stage C:systemic therapy, and patients with any degree of liver function who meet the Milan’s criteria: liver transplantation.
Abbreviations: BCLC, Barcelona Clinic Liver Cancer; LAT, local ablation therapy; TACE, transarterial chemoembolization.
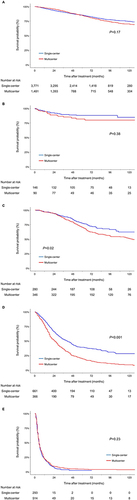
Table 5 Subgroup Analysisa