
Figures & data
Table 1 APS Classification
Table 2 Baseline Characteristics
Figure 1 Flow chart.
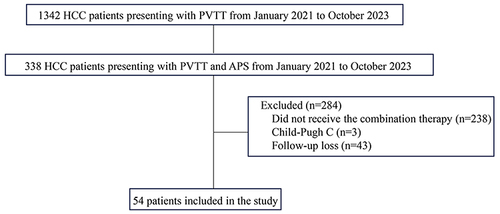
Table 3 Outcome of APS
Figure 2 Representative radiographical images of a patient who achieved APS disappearance after treatment. Images of man aged 50 years with HCC and severe APS after receiving the combination therapy. Axial contrast-enhanced CT images in the arterial phase (a) and portal phase (b) before the initiation of treatment. CT images taken during the arterial phase (a) displayed early enhancement of portal vein branches (indicated by a black arrow), representing APS. Hepatic angiography (c) revealed severe APS (indicated by a black arrow). Subsequent axial contrast-enhanced CT images in the arterial (d) and portal (e) phase were taken after three sessions of HAIC, showing no apparent APS. Hepatic angiography in image (f) confirmed the absence of APS.
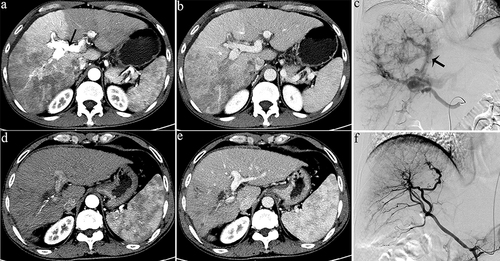
Figure 3 The best tumor response (A) and PVTT response (B) observed during treatment, and tumor response (C) and PVTT response (D) after two sessions of HAIC.
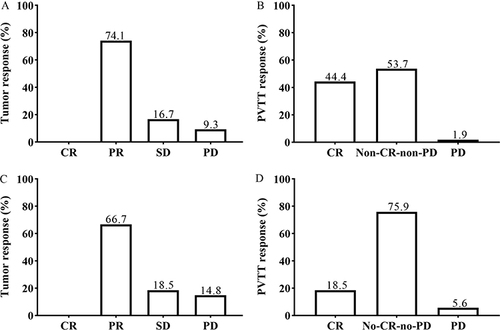
Figure 4 Overall survival (a) and intrahepatic progression-free survival (b) by Kaplan-Meyer analysis, and subgroup analysis for overall survival and intrahepatic progression-free survival considering the presence or absence of APS (c and d).
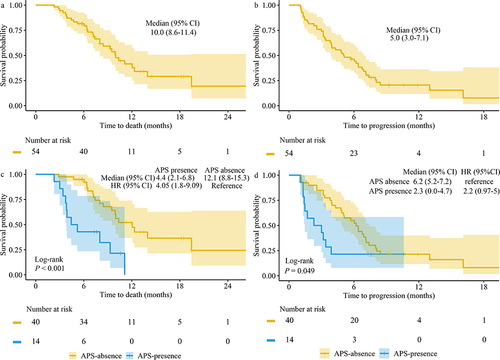
Table 4 Univariate and Multiple Analysis of Prognostic Factor for OS
Table 5 Univariate and Multiple Analysis of Prognostic Factor for InPFS
Table 6 Adverse Events