
Figures & data
Table 1 Baseline Clinical Characteristics
Figure 1 Patient screening flowchart.
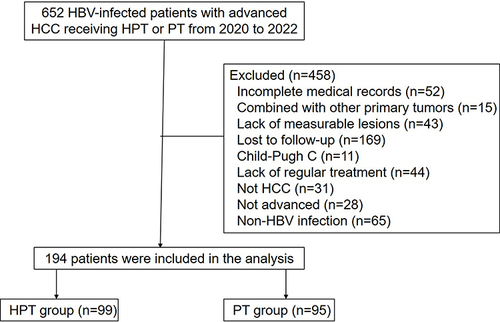
Figure 2 Kaplan–Meier curves for progression-free survival (A) and overall survival (B).
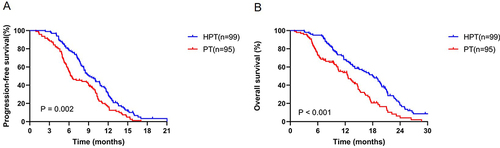
Table 2 Summary of Best Response
Figure 3 Best assessment of intrahepatic target lesions in both groups.
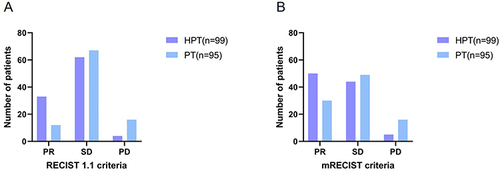
Table 3 Univariate and Multivariate Analysis of Risk Factors for Overall Survival in Combined HAIC Group
Figure 4 Time-dependent ROC curve of overall survival at 1 year for SIRI (A) and ALBI (B).
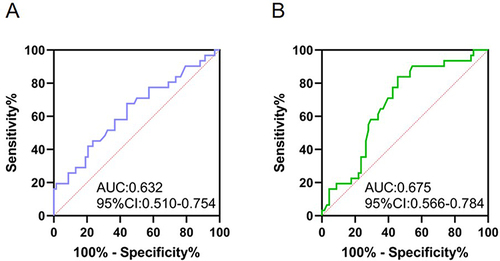
Figure 5 The OS of patients with HBV-related advanced HCC treated with HAIC combined with PD-1 inhibitors plus TKIs. Notes: (A) OS according to the SIRI. (B) OS according to the ALBI value.
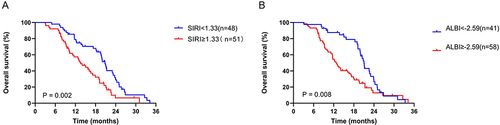
Table 4 Treatment-Related Adverse Events
Data Sharing Statement
The datasets generated during the current study are available from the corresponding author on reasonable request.