Figures & data
Table 1 Demographic and Clinical Characteristics of the Patients in Two Cohorts
Figure 1 Screening of variables using Lasso regression and Random Survival Forest (A) The variation characteristics of variable coefficients in Lasso regression; (B) The process of selecting the optimal value for the parameter λ in the Lasso regression model was conducted through a cross-validation method. (C) Error rate of the Random Survival Forest; (D) Out-of-bag variable importance ranking of the Random Survival Forest.
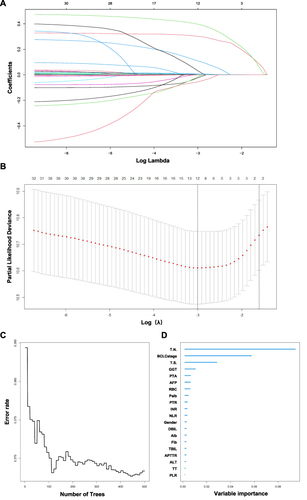
Figure 2 Nomogram for predicting time-related recurrence in elderly patients with early-stage HCC after ablation therapy.
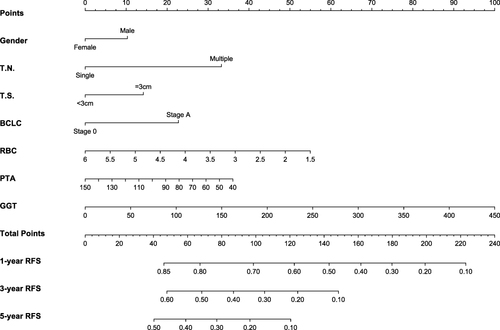
Figure 3 Comparison of ROC curves for the original scoring system at various time points in both the primary (A) and validation (B) cohorts.
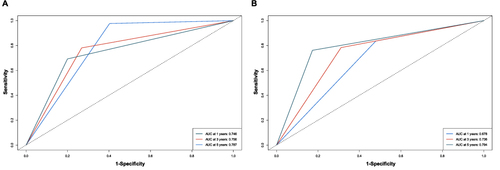
Figure 4 Calibration plots of predicted 1-, 3-, and 5-year RFS based on Cox regression modeling in the primary and validation cohorts. (A) primary cohort; (B) validation cohort.
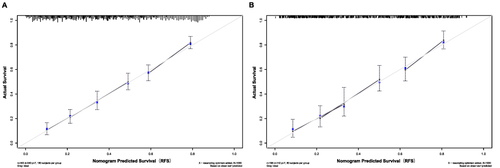
Figure 5 The DCA curves of the original scoring system in 1, 3, and 5 years of RFS in the primary (A) and validation (B) cohorts.
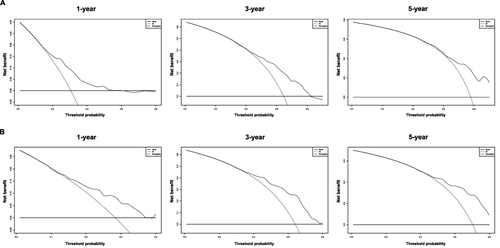
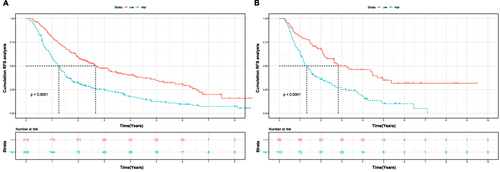
Figure 6 The risk stratification for RFS is based on the nomogram risk scores in the primary (A) and validation (B) cohorts.