
Figures & data
Figure 1 Research technology roadmap.
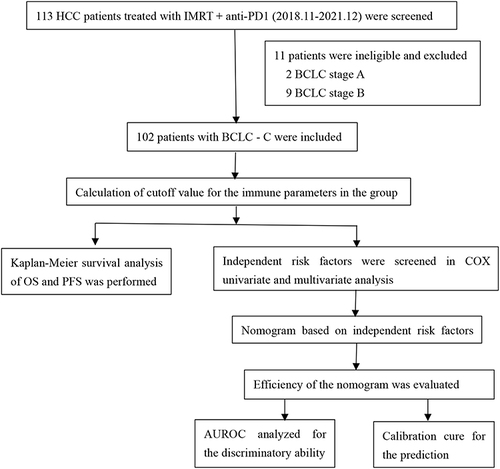
Table 1 Baseline Characteristics of the Patients
Table 2 Summary of Efficacy Outcomes (N=93)
Figure 2 Kaplan–Meier analysis of overall and progression free survival.
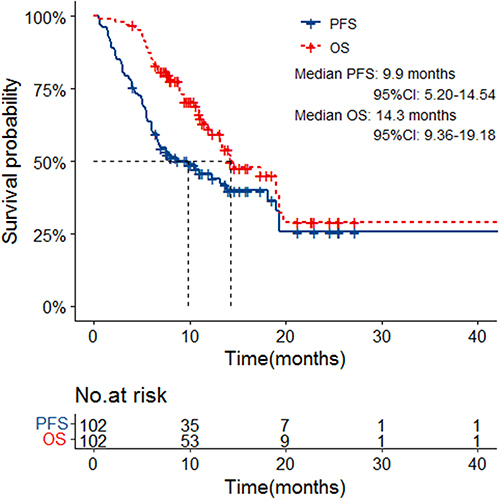
Figure 3 Best percentage change from baseline in sums of diameters of target lesions.
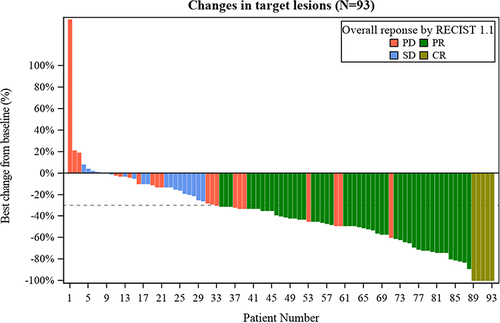
Table 3 Univariate and Multivariate Cox Regression Analyses for Overall Survival and Progression-Free Survival
Figure 4 Survival nomogram (A). The total points of each patient can be used to predict survival outcome. ROC curves and AUROCs for the prediction of death within 1–3year among HCC patients after IMRT and anti-PD1 (B). Calibration curve for the prediction of death within 1 years among HCC patients after IMRT and anti-PD1 (C).
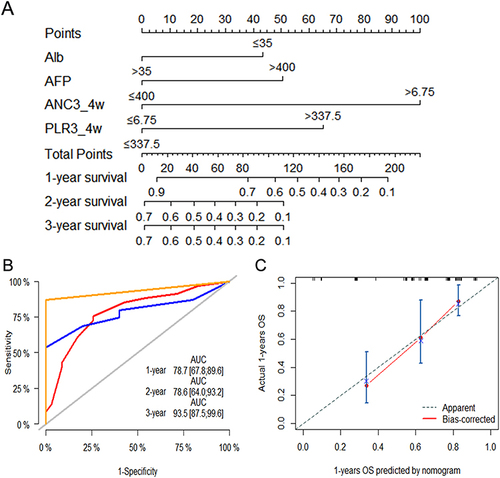
Table 4 Adverse Events of Laboratory Testing After IMRT+ Anti-PD1 Treatment
Data Sharing Statement
The data underlying this article will be shared on reasonable request to the corresponding author.