
Figures & data
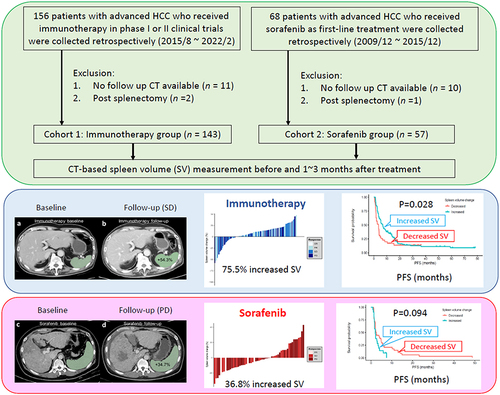
Figure 1 Study flowchart.
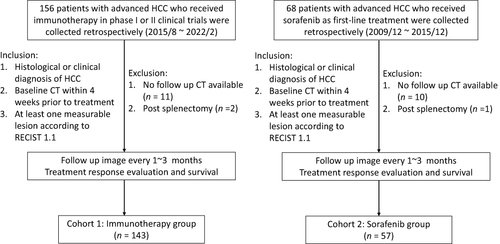
Figure 2 CT-based SV measurement. Upper panel displays the CT scans of a 66-year-old man who underwent therapy with atezolizumab, bevacizumab, and tocilizumab. His SV increased by approximately 54.3%, from 85 cm3 at baseline to 132 cm3 at his 41-day follow-up CT scan. His condition remained stable, and he experienced a DCB, with PFS of 13.8 months. Lower panel displays the CT scans of a 39-year-old man with advanced HCC treated with sorafenib. His SV increased by approximately 34.7%, from 656 cm3 at baseline to 884 cm3 at his 42-day follow-up CT scan. Despite treatment, his condition worsened, and he exhibited PFS of 1.4 months.
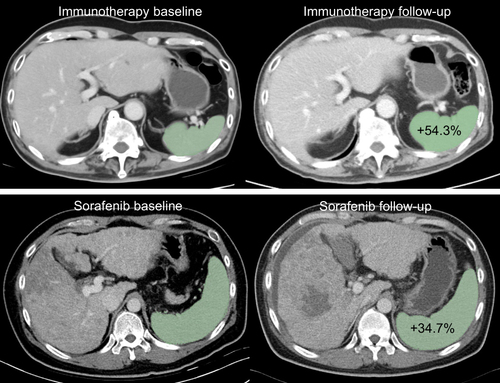
Table 1 Patient Characteristics and Treatment Response in the Immunotherapy and Sorafenib Groups
Figure 3 Waterfall plots of optimal tumor response versus SV changes. (A) immunotherapy group. (B) sorafenib group.
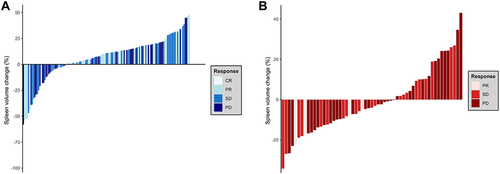
Table 2 Comparison of SV Changes in the Immunotherapy Group
Table 3 Multivariate Analysis of DCB by Logistic Regression in the Immunotherapy and Sorafenib Groups
Table 4 Multivariate Analysis of PFS by Cox Regression in the Immunotherapy and Sorafenib Groups
Figure 4 Kaplan–Meier curves of PFS versus SV changes. (A) immunotherapy group. (B) sorafenib group. All p values were determined using a Log rank test.
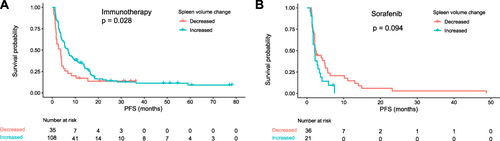
Table 5 Comparison of SV Changes in the Sorafenib Group
Table 6 Multivariate Analysis of DCB by Logistic Regression in the Immunotherapy and Sorafenib Groups After Inverse Probability of Treatment Weighting Adjustment
Table 7 Multivariate Analysis of PFS by Cox Regression in the Immunotherapy and Sorafenib Groups After Inverse Probability of Treatment Weighting Adjustment
Data Sharing Statement
For ethical reasons, the data are not publicly available. The data sets generated and analyzed in this study are available from the corresponding author upon reasonable request.