30
Views
0
CrossRef citations to date
0
Altmetric
ORIGINAL RESEARCH

The Potential of the lncRNAs ADAMTSL4-AS1, AC067931 and SOCS2-AS1 in Peripheral Blood Mononuclear Cells as Novel Diagnostic Biomarkers for Hepatitis B Virus-Associated Hepatocellular Carcinoma

, ORCID Icon, , , ORCID Icon, , ORCID Icon, ORCID Icon, , , & show all
Pages 1221-1233 | Received 17 Apr 2024, Accepted 24 Jun 2024, Published online: 28 Jun 2024

Figures & data

Table 1 Primer Sequences of the qRT-PCR Used in This Study

Figure 1 Bioinformatics analysis of transcriptomics data. (A) Clustering Heatmap of DELs among CHB, LF/LC and HCC tissues. The columns represented the clinical liver samples, and the rows indicated as DELs. Blue and red indicate down- and up-regulation, respectively. (B) Venn diagram showing the differential expression level of each lncRNA of the three comparison groups. Volcano plots for DELs between CHB and HCC (C) as well as LF/LC and HCC (D) groups. The red points indicated up-regulated lncRNAs, while the blue points represented down-regulated lncRNAs. The grey points represented non-significant differently expressed lncRNAs. (E and F) GO enrichment and KEGG pathway analyses of the identified lncRNAs. The depth of color and size of black spots denote the adjusted p-value and lncRNA quantities, respectively.

Abbreviations: DELs, differentially expressed lncRNAs; CHB, chronic hepatitis B; LF, liver fibrosis; LC, liver cirrhosis; HCC, hepatocellular carcinoma; lncRNA, long non-coding RNA; GO, Gene Ontology; KEGG, Kyoto Encyclopedia of Genes and Genomes.
Figure 1 Bioinformatics analysis of transcriptomics data. (A) Clustering Heatmap of DELs among CHB, LF/LC and HCC tissues. The columns represented the clinical liver samples, and the rows indicated as DELs. Blue and red indicate down- and up-regulation, respectively. (B) Venn diagram showing the differential expression level of each lncRNA of the three comparison groups. Volcano plots for DELs between CHB and HCC (C) as well as LF/LC and HCC (D) groups. The red points indicated up-regulated lncRNAs, while the blue points represented down-regulated lncRNAs. The grey points represented non-significant differently expressed lncRNAs. (E and F) GO enrichment and KEGG pathway analyses of the identified lncRNAs. The depth of color and size of black spots denote the adjusted p-value and lncRNA quantities, respectively.

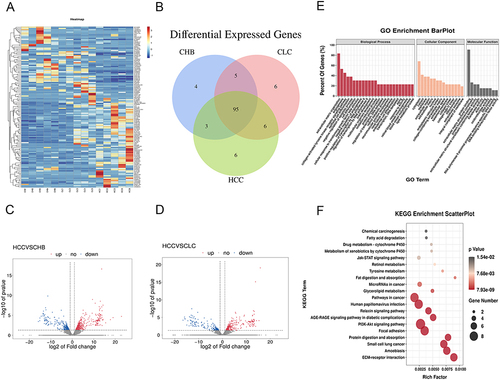
Table 2 Clinical and Laboratory Characteristics of the Paticipants

Figure 2 The relative expression profile of the selected lncRNAs in CHB patients, HBV-associated LC patients, and HBV-associated HCC patients. Relative lncRNA expression levels in PBMC samples were detected by qRT-PCR. (A) ADAMTSL4-AS1, (B) AC067931, (C) SOCS2-AS1, (D) AL731577, (E) TPM-AS, (F) AL356356, (G) AC037198, (H) AP002026. The expression levels of related lncRNAs in liver tissues were detected by qRT-PCR. (I) ADAMTSL4-AS1, (J) AC067931, (K) SOCS2-AS1, (L) AL731577. Relative expression levels of lncRNAs were upregulated in four human HCC cells(Huh7, HepG2, Hep3B, HepG2.215) comparison with Lx2 cells determining by qRT-PCR. (M) ADAMTSL4-AS1, (N) AC067931, (O) SOCS2-AS1. *p<0.05, **p<0.01, ***p<0.001, ****p<0.0001.

Figure 2 The relative expression profile of the selected lncRNAs in CHB patients, HBV-associated LC patients, and HBV-associated HCC patients. Relative lncRNA expression levels in PBMC samples were detected by qRT-PCR. (A) ADAMTSL4-AS1, (B) AC067931, (C) SOCS2-AS1, (D) AL731577, (E) TPM-AS, (F) AL356356, (G) AC037198, (H) AP002026. The expression levels of related lncRNAs in liver tissues were detected by qRT-PCR. (I) ADAMTSL4-AS1, (J) AC067931, (K) SOCS2-AS1, (L) AL731577. Relative expression levels of lncRNAs were upregulated in four human HCC cells(Huh7, HepG2, Hep3B, HepG2.215) comparison with Lx2 cells determining by qRT-PCR. (M) ADAMTSL4-AS1, (N) AC067931, (O) SOCS2-AS1. *p<0.05, **p<0.01, ***p<0.001, ****p<0.0001.

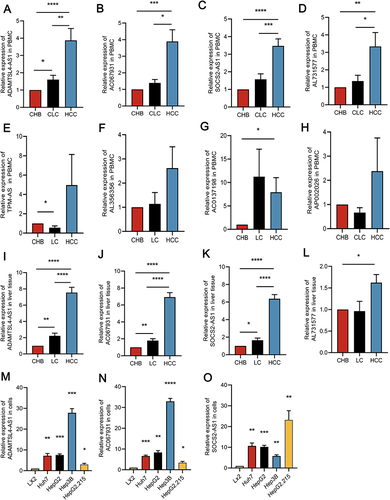
Table 3 Correlation of Clinicopathological Variables with the Expression of ADAMTSL4-AS1, AC067931 and SOCS2-AS1 in PBMCs from HBV-Associated HCC Patients

Table 4 Differential Diagnostic Efficacy of PBMC ADAMTSL4-AS1, AC067931, SOCS2-AS1, AFP, the Combined and the Combined+AFP

Figure 3 Area under receiver operating characteristic curves (AUROCs) of lncRNAs and AFP for differentiating the HBV-related HCC group from the HBV-associated with non-HCC groups. (A) HCC from CHB (B) HCC from LC (C) HCC from CHB+LC. ROC curve analysis for the individual lncRNAs or AFP or their combinations in the diagnosis of (D) AFP negative HCC patients, (E) small HCC patients and (F) early-stage HCC patients from CHB+LC.

Figure 3 Area under receiver operating characteristic curves (AUROCs) of lncRNAs and AFP for differentiating the HBV-related HCC group from the HBV-associated with non-HCC groups. (A) HCC from CHB (B) HCC from LC (C) HCC from CHB+LC. ROC curve analysis for the individual lncRNAs or AFP or their combinations in the diagnosis of (D) AFP negative HCC patients, (E) small HCC patients and (F) early-stage HCC patients from CHB+LC.

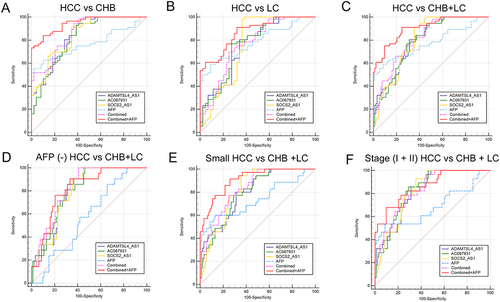
Table 5 Diagnostic Efficacy of Individual PBMC lncRNAs or AFP or Their Combinations in AFP(-), Small, and Early-Stage HCC Patients