
Figures & data
Figure 1 Expression of LAYN in HCC. (A) Pancancer analysis of LAYN expression in multiple human cancer types using the TIMER database. (B and C) mRNA expression of LAYN in HCC tumor tissues (n=369) and normal tissues (n=160) analyzed by the GEPIA database (B), as well as in paired HCC tumor and peri-tumor tissues using the TCGA RNA-sequencing data (C) (n=49). (D) Analysis of LAYN mRNA expression in paired HCC tumor and peri-tumor tissues (n=13). (E) Representative images of immunohistochemistry for LAYN protein expression in HCC tissues. Student’s t-test (C and D) was performed, and the data were presented as the mean ± SEM. Results were replicated (n = 3 experiments) (D and E). *P < 0.05; ***P < 0.001.
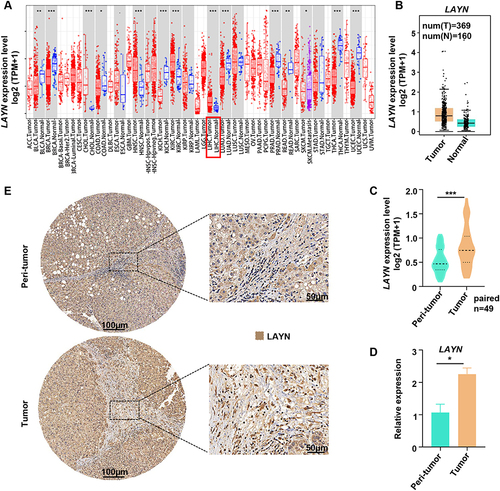
Figure 2 The prognostic value analysis of LAYN in HCC patients using the TCGA database. (A–D) Kaplan-Meier curves of overall survival (OS), disease-free survival (DFS), Disease-specific survival (DSS) and Progression-free survival (PFS) based on LAYN expression in TCGA cohort. (E and F) Kaplan-Meier curves of OS and PFS based on LAYN+CD8+ T cell frequency. (G and H) The violin chart displayed the association between LAYN expression and gender (G), or the correlation of LAYN expression with TNM stage (H). Log rank tests was performed for Kaplan-Meier curves and Log-rank p value were shown (A–F). Student’s t-test (G and H) was performed, and the data were presented as the mean ± SEM. ns, not significant.
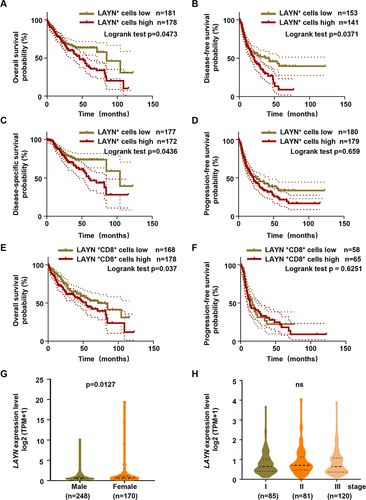
Table 1 Correlation Analysis Between LAYN and Markers of Immune Cells in HCC via the TIMER Database
Figure 3 LAYN is highly expressed in CD8+ TILs and intratumoral LAYN+CD8+ T cells accumulate in HCC tumor tissues. (A and B) Correlation analysis between LAYN expression and immune cells including CD8+ T cells in HCCs using the TIMER database. (C) Representative images demonstrating double-stained LAYN+CD8+ T cells in HCC tumor tissue and peri-tumor tissue, captured at magnifications of 200× and 400×. (D) mRNA expression of LAYN in peripheral blood, peri-tumor and tumor tissues. Data represent five individual patients. (E and F) Representative flow cytometric images of the proportion/median fluorescence intensity (MFI) level of LAYN+CD8+ T cells in peripheral blood, peri-tumor and tumor tissues (n=8). Cells were pregated on CD45, CD3 and CD8. Student’s t-test (D and F) was performed, and the data were presented as the mean ± SEM. Results were replicated (n = 3 experiments) (C–F). **P < 0.01.
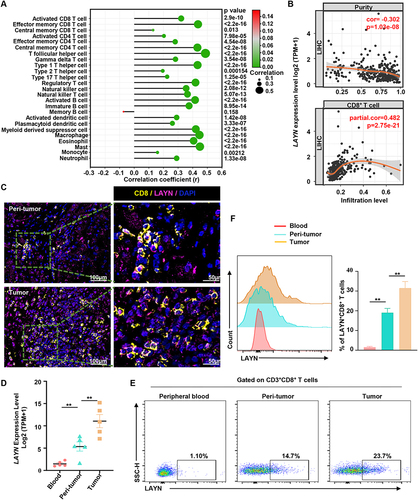
Figure 4 Dysfunctional phenotypic characteristics of tumor infiltrating LAYN+CD8+ T cells in HCC. (A) The scatter plots illustrated the gene expression of LAYN-related genes in freshly isolated LAYN+CD8+ T cells and LAYN−CD8+ T cells from HCC tumor tissues. Data represent five individual patients. (B) A heatmap to show the global phenotypic characteristics of LAYN+CD8+ T cells and LAYN−CD8+ T cells from HCC tissues detected by flow cytometry. Cells were pregated on CD45, CD3 and CD8. Data represent eight individual patients. (C–F) Representative flow cytometric overlays of different markers expressed by LAYN+ (green line) and LAYN− (grey line) CD8+ T cells, including exhaustion associated immune checkpoint inhibitors (C), differentiation and activation markers (D), adhesion and localization related molecules (E and F). Student’s t-test (A) was performed, and the data were presented as the mean ± SEM. Results were replicated (n = 3 experiments) (B–F).
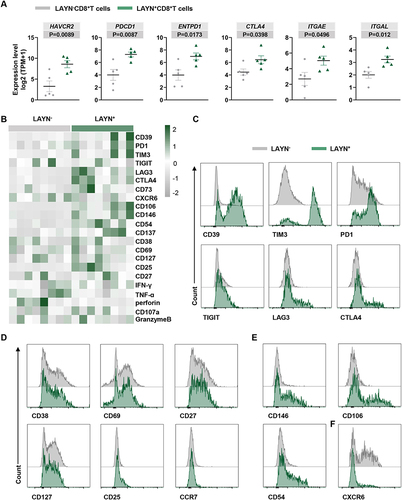
Figure 5 The highly expressed genes in LAYN+ CD8+ T cells have a specific enrichment pathway. (A) GO function analysis based on differentially up-regulated genes within LAYN+ CD8+ T cells detected by mRNA-seq compared to non-exhausted cells. (B) Up-regulated genes within LAYN+ CD8+ T cells enriched in the top 9 GO terms. (C) Enriched pathways within the Kyoto Encyclopedia of Genes and Genomes database based on differentially up-regulated genes within LAYN+ CD8+ T cells. The p value was set to < 0.01 (A). The p value was set to < 0.05 (C).
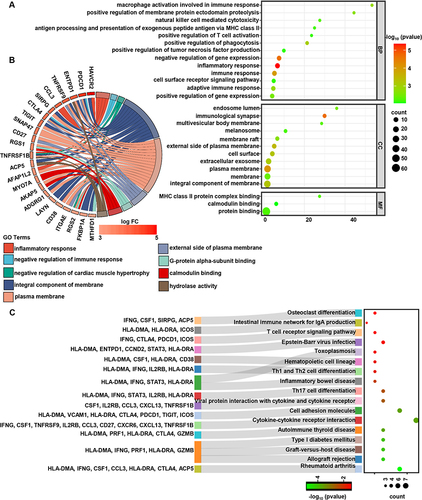
Figure 6 Assessment of anti-inflammatory cytokines profiling and cytotoxic potential of tumor infiltrating LAYN+ CD8+ T cells. (A) The scatter plots displayed the gene expression of cytokines and cytotoxic molecules in freshly isolated LAYN+CD8+ T cells and LAYN−CD8+ T cells from HCC tumor tissues. Data represent five individual patients. (B and C) Representative flow cytometric plots (B) and statistical results (C) to show the pro-inflammatory cytokines IFN-γ and TNF-α secreting profile of intra-tumoral LAYN+ and LAYN− CD8+ T cells following the stimulation of PMA, ionomycin and Brefeldin for 6 h (n ≥ 8). (D and E) Representative flow cytometric overlays (D) and statistical data (E) of intracellular Granzyme B, CD107a and perforin expression in freshly isolated LAYN+ and LAYN− CD8+ T cells from HCC tumor tissues (n ≥ 5). (F) Flow cytometry analysis of proliferation molecules (Ki-67) expression in LAYNOE-CD8+ T cells and control virus-infected cells. (G and H) The apoptosis assay (using CFSE/PI staining) of 97H tumor cell line after co-culture with LAYNOE- CD8+T cells or control virus-infected cells at different (E)T ratio of 1:1, 2:1 or 5:1 for 20h (n = 4). Student’s t-test (A, C, E, F and H) was performed, and the data were presented as the mean ± SEM. Results were replicated (n = 3 experiments) (B–H). *P < 0.05; **P < 0.01.
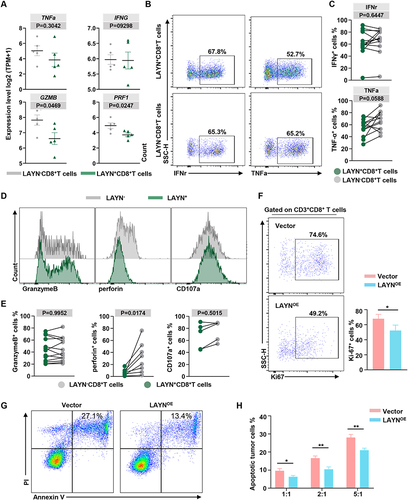
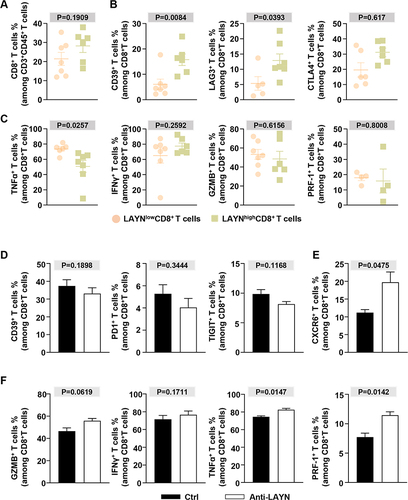
Figure 7 Intratumoral LAYN+ CD8+ T cell high infiltration impairs total CD8+ T cell partial immune function in HCC patients and antagonizing LAYN can partially reverse CD8+ T cell functions. (A) CD8+ T cell infiltration level in LAYN+CD8+ T cell high or low subgroup. (B and C) The charts showed the expression of co-inhibitory receptors (B) and effector markers, cytotoxic molecules (C) for total CD8+ T cells in LAYN+CD8+ T cell high or low subgroup. (D-F) Single cells isolated from HCC tumor tissues were incubated with LAYN antagonist (ANT-518) or vehicle for 36 h. The percentage of immune checkpoint molecules (D), receptor molecule (E) and effector markers, cytotoxic molecules (F) were analyzed by flow cytometry (n ≥ 3). Cells were pregated on CD45, CD3 and CD8. Student’s t-test (A–F) was performed, and the data were presented as the mean ± SEM. Results were replicated (n = 3 experiments) (A–F).
Data Sharing Statement
Data are available upon reasonable request. All data generated that are relevant to the results presented in this article are included in this article or Supplementary Materials.