Figures & data
Figure 1 vWF derived from HCC cells promotes tumor migration through inducing glycolysis in vitro. (A) The expression levels of vWF in L-02, HUVEC and HCC cell lines. (B–D) PAS staining, glycogen and L-lactate content of vWF overexpression and knockdown HCC cells. ***P<0.001, compared with vWF psilence group; #P<0.05, ###P<0.001, compared with vWF pcDNA group. (E and F) Wound-healing and Transwell assays revealed the migration ability of HCC cells under the treatment of vWF OE and 0.5 μM CP-91149.
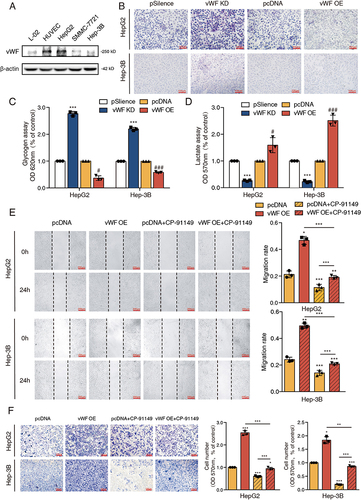
Figure 2 vWF mediates the crosstalk between HCC cells and HSCs. (A) The expression correlation of vWF and ACTA2 in HCC tissues. (B) The distribution area of α-SMA and vWF in tumor region. Arrows point to feature areas. (C) vWF expression levels of HCC cells with or without LX-2 co-culturing for 48 h. (D) The influence of co-culturing with HCC cells expressing different vWF levels to the activation of LX-2 cells. (E and F) Migration ability of HCC cells expressing different vWF levels with LX-2 co-culturing for 48 h reflected by Wound-healing and Transwell assays.
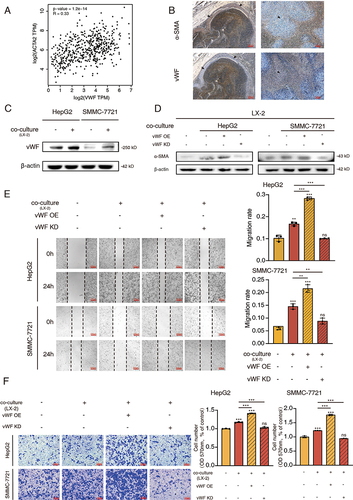
Figure 3 IL-6/JAK1 signaling pathway activated by co-culture system regulates vWF mediated glycolysis and migration of HCC cells. (A) Heatmap results (left) of the top 100 differentially expressed genes in GSE62455 dataset and GSEA results (right) of JAK/STAT signaling pathway. (B) IL-6 expression levels of LX-2 cells with or without HCC cells co-culturing for 48 h. (C) vWF expression levels in HepG2 cells under the treatment of gradient concentrations of exogenous IL-6 for 48 h. (D) vWF expression levels in HCC cells with or without 3 μM pyridone 6 treatment for 48 h. (E) The phosphorylation levels of JAK1 in HCC cells with or without LX-2 cells co-culturing for 48 h. (F) Glycogen content of HepG2 cells treating with vWF OE and pyridone 6 detected by PAS staining. (G and H) Migration ability of HepG2 cells treating with vWF OE and 3 μM pyridone 6 reflected by Wound-healing and Transwell assays.
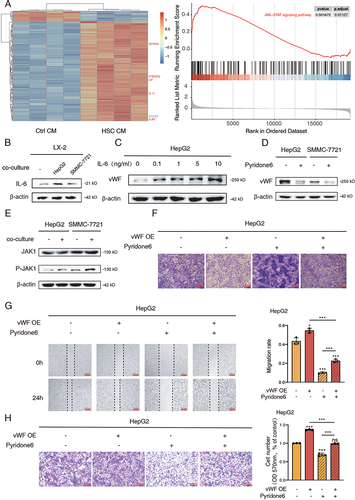
Figure 4 LX-2 enhances vWF mediated TGFB1 expression and secretion by activating the JAK signaling pathway. (A) qPCR results of cytokines related to hepatic stellate cell activation in HCC cells with or without LX-2 co-culturing for 48 h. (B) Relative mRNA expression data of TGFB1 in HCC cells under pcDNA and vWF OE conditions. ***P<0.001, compared with HepG2 vWF pcDNA group; ###P<0.001, compared with SMMC-7721 vWF pcDNA group. (C) The concentrations of TGFB1 in cell medium was detected by ELISA.**P<0.01, compared with HepG2 vWF pcDNA group; ##P<0.01, compared with SMMC-7721 vWF pcDNA group. (D) Western blot results of LX-2 activation levels with the treatment of gradient concentrations of exogenous TGFB1 for 48 h. (E) TGFB1 expression in HCC cells with the treatment of vWF OE and 3 μM pyridone 6 reflected by Western blotting. (F and G) Functions of TGFB1 and TGFB1R2 in mediating the migration ability of HepG2 cells by Wound-healing. (H and I) Functions of TGFB1 and TGFB1R2 in mediating the migration ability of HepG2 cells by Transwell assays.
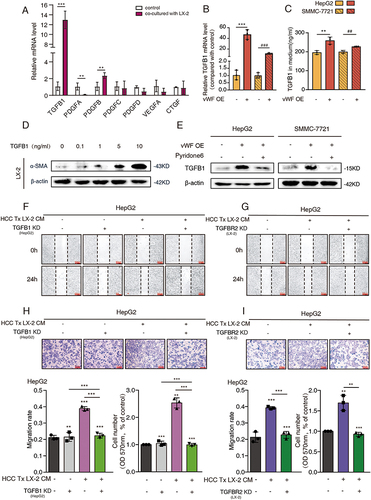
Figure 5 TGFB1 derived from HCC cells promotes cancer cell migration and glycolysis through activating HSCs. HepG2 cells transfected with vWF OE and TGFB1 KD or treated by pyridone 6 co-cultured with LX-2 cells transfected with TGFBR2 KD were used for (A) Western blot analysis of α-SMA levels of LX-2 cells; (B and C) Glycogen content reflected by PAS staining and glycogen assays; (D) L-lactate content tested by L-lactate assays; (E and F) Migration ability was examined by Wound-healing and Transwell assays.
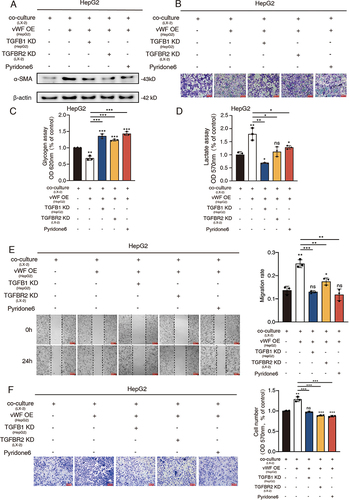
Figure 6 HSCs enhance tumor growth through JAK1/vWF/TGFB1 axis in vivo. Cells with different treatment were injected subcutaneously into nude mice and solid tumors were collected for the further analysis. (A) Tumor images; (B and C) Tumor weight and volume; (D) IHC staining results of vWF and TGFB1 in different groups; (E and F) IHC score results of vWF and TGFB1 in different groups.
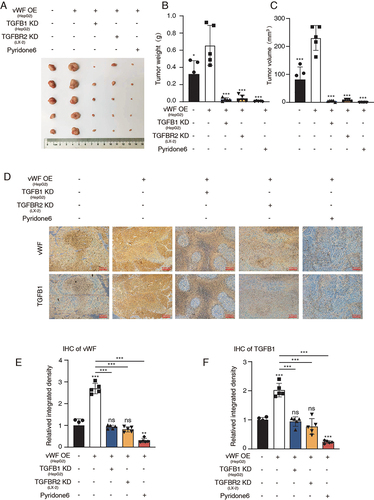
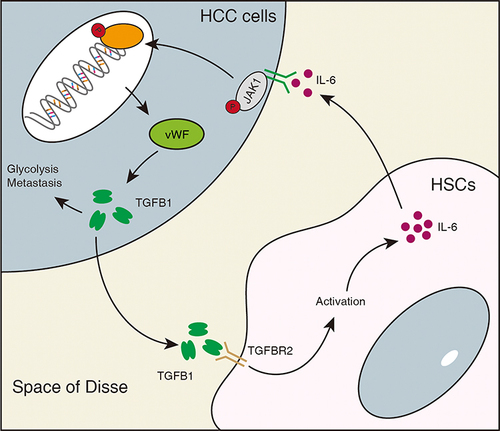
Figure 7 Schematic diagram illustrating the mechanism of HSC-derived IL-6 in promoting vWF mediated HCC glycolysis and migration. IL-6 from hepatic stellate cells promotes glycolysis and migration of HCC through the JAK1/vWF/TGFB1 axis. In addition, TGFB1 secreted by HCC cells further promotes the activation of hepatic stellate cells.