Figures & data
Figure 1 Flow chart for screening patients.
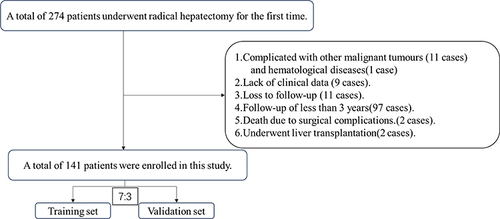
Figure 2 Flowchart of radiomics analysis.
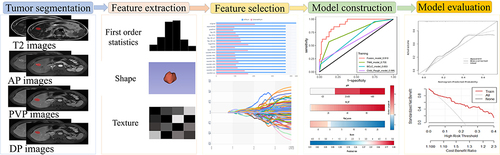
Table 1 Baseline Characteristics of Training and Validation Groups
Table 2 Clinical and Pathological Factors for 3-Year Survival in Patients with HCC
Table 3 The Predictive Performance of Imaging Radiomics Features E×tracted from MR Sequences by Various Classifiers
Figure 3 The construction process of the fusion model. (a) Variance threshold on feature select. (b) Select K best on feature select. (c) Lasso algorithm on feature select. (d) Lasso path-; MSE path. coefficients in Lass model. Coefficients in the Lasso model. (e) Using the Lasso model, 18 features which are correspond to the optimal alpha value were selected. (f) Heatmap depicting the correlation coefficient matrix in the radiomics model.
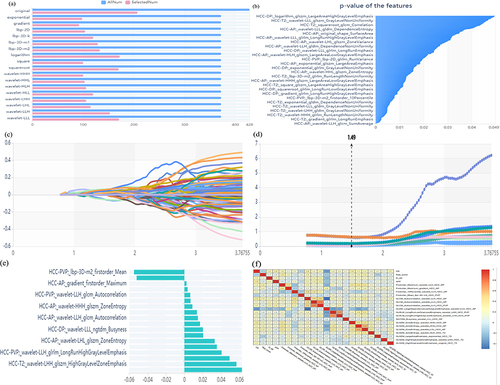
Figure 4 The ROC curve of different models predicts 3-year OS.
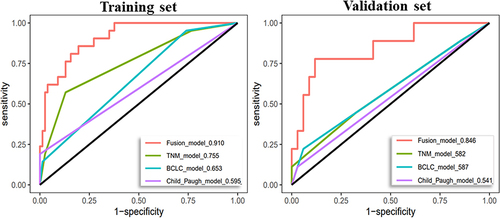
Figure 5 Nomograms for predicting the 3-year OS of HCC patients.
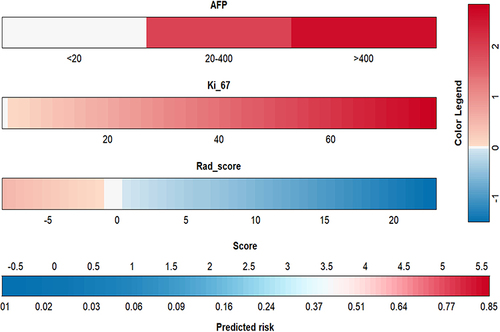
Figure 6 Calibration curves for training and validation sets.
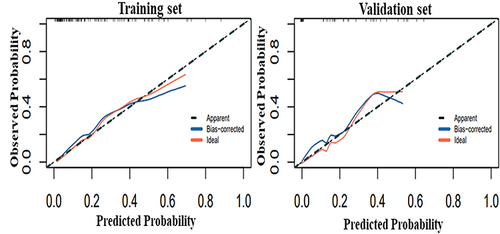
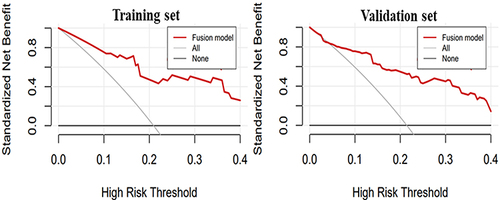
Figure 7 Decision curves for training and validation sets.