
Figures & data
Figure 1 Flowchart showing the patient selection process, construction, and external validation of the nomogram.
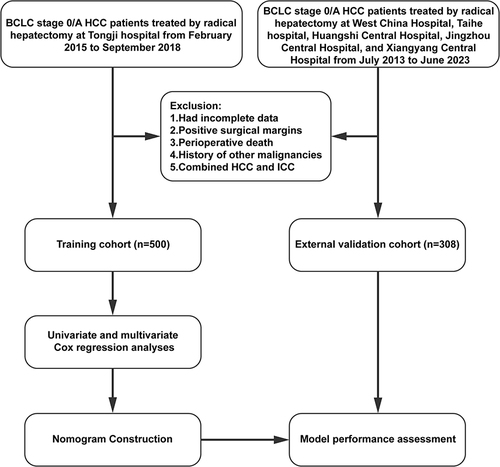
Table 1 Baseline Characteristics of BCLC Stage 0/A HCC Patients Who Underwent Hepatectomy in the Training and External Validation Cohorts
Table 2 Univariate and Multivariate Cox Regression Analysis of Independent Risk Factors Associated with Disease-Free Survival (DFS) in the Training Cohort
Figure 2 (A) The nomogram model for predicting 2-year and 5-year DFS. (B) The 2-year and 5-year receiver operating characteristic (ROC) curve of DFS in the training cohort. (C) The 2-year and 5-year ROC curves of DFS in the external validation cohort.
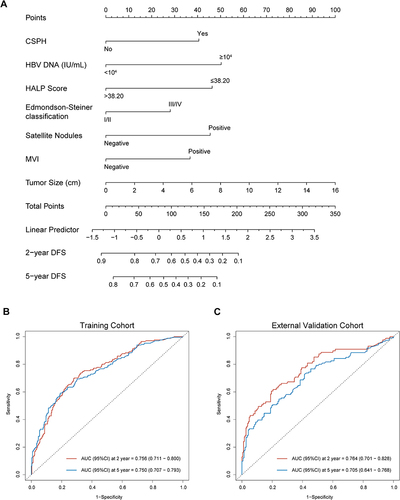
Figure 3 Calibration curve for predicting the 2-year DFS (A) and the 5-year DFS (B) in the training cohort and the 2-year DFS (C) and the 5-year DFS (D) in the external validation cohort.
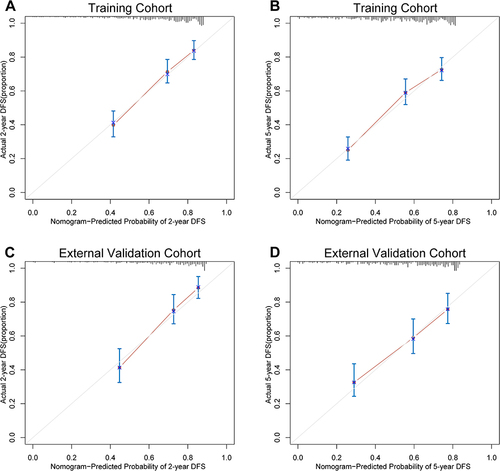
Figure 4 DCA plots for the nomogram in predicting the 2-year DFS (A) and the 5-year DFS (B) in the training cohort and the 2-year DFS (C) and the 5-year DFS (D) in the external validation cohort.
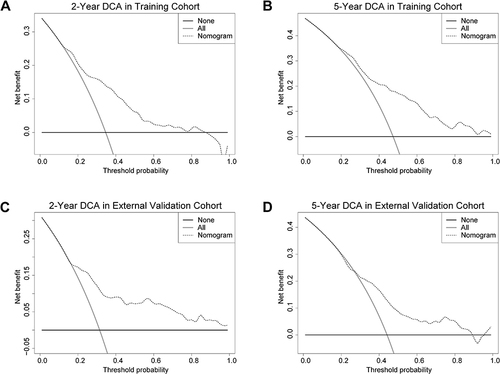
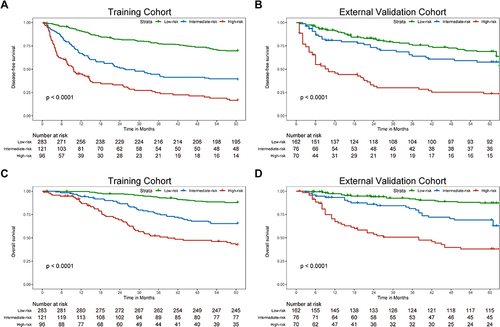
Figure 5 The Kaplan-Meier survival curves for low-, intermediate- and high-risk groups of BCLC stage 0/A HCC patients after radical liver resection based on our nomogram calculated risk scores. The disease-free survival Kaplan-Meier survival curves in the training cohort (A) and the external validation cohort (B). The overall survival Kaplan-Meier survival curves in the training cohort (C) and the external validation cohort (D).
Data Sharing Statement
The datasets used and analyzed in this study can be obtained from the corresponding author upon reasonable request.