Figures & data
Figure 1 Combined stimulation with NOD1,2 and C-type lectin receptor (Mincle, Dectin-1) agonists leads to enhanced NF-κB/AP-1-dependent SEAP reporter gene expression in THP-1-XBlue-CD14 cells. (A) Western blot analysis of NOD1, NOD2, Mincle, and Dectin-1 receptor expression in THP1-XBlue-CD14 and control HEK-Blue-Null1 and HEK-Blue-Null2 cells. (B) THP1-XBlue-CD14 cells were either stimulated with individual PRR agonists (C12-iE-DAP, L18-MDP, TDB, or Curdlan) or with combinations: C12-iE-DAP plus Curdlan, C12-iE-DAP plus TDB or L18-MDP plus TDB, L18-MDP plus Curdlan at the indicated concentrations (µg/mL) for 18 h. Untreated cells were used as control. Results are expressed as the fold increase in NF-κB/AP-1-dependent SEAP activity relative to untreated cells (values are mean from three independent experiments, each performed in duplicate). Error bars indicated standard deviations (SD). *Indicates potentiated (greater than the sum of the fold induction observed after stimulation of single PRR at the same doses of agonists) NF-κB/AP-1-dependent SEAP reporter gene expression levels in group treated with combination of CLR and NOD agonists.
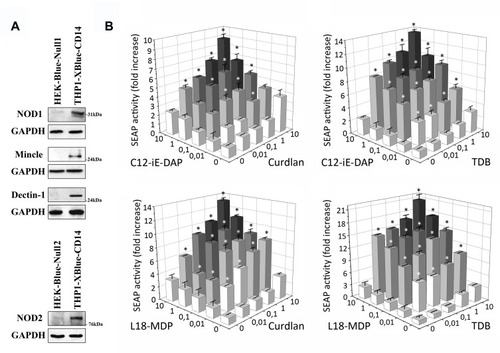
Figure 2 Analysis of NF-κB/AP-1-related molecular pathways activated in THP1 cells in response to individual or combined Mincle and NOD2 stimulation. (A) Profiles of phosphorylation states of multiple proteins related to NF-κB/AP-1 pathways. Cells were left untreated or treated with TDB (10 μg/mL) and L18-MDP (0.1 μg/mL) alone or in combination. Levels of total proteins as well as phosphorylated forms were measured 15 min (ERK1/2, Akt) and 40 min (p65 subunit NF-κB, IκB, IKKα/β, p38, JNK) after PRR stimulation using MILLIPLEX Magnetic Bead Signaling kits and a Bio-Plex MAGPIX multiplex reader (Bio-Rad). Data were collected from triplicate samples in two independent experiments and are presented as the ratio of the mean fluorescent intensity (MFI) of the phosphorylated form to MFI of total protein ± SD. *Indicates significant difference (p≤ 0.05, Student’s t-test) between individual treatment with PRR agonists and the intact cells. #Indicates significant difference (p≤ 0.05, Student’s t-test) between group treated with combination of PRR agonists in comparison to individual PRR agonists. (B) Detection of NF-κB subunit p65 in nuclear and cytoplasmic lysates of THP-1 cells treated for 30 min with TDB (10 μg/mL) and L18-MDP (0.1 μg/mL) alone or in combination. Control cells left untreated.
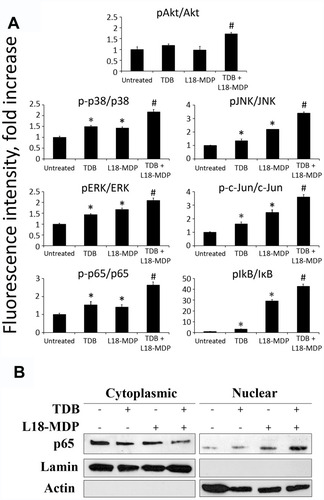
Figure 3 Combined stimulation of CLR and NOD receptors leads to enhanced IL-8 production in THP-1 cells. THP-1 cells were stimulated with (A) Curdlan plus C12-iE-DAP, (B) TDB plus C12-iE-DAP, (C) Curdlan plus L18-MDP, (D) TDB plus L18-MDP at the indicated concentrations for 24 h. Concentrations of IL-8 in the culture cell-free supernatants were measured using singleplex bead-based Bio-Plex Pro kit. Results are representative of two separate experiments, each performed in triplicate. Mean ± SD is shown for triplicate samples. *Indicates potentiated (greater than the sum of the fold induction observed after stimulation of single PRR at the same doses of agonists) IL-8 production in group treated with combination of CLR and NOD agonists.
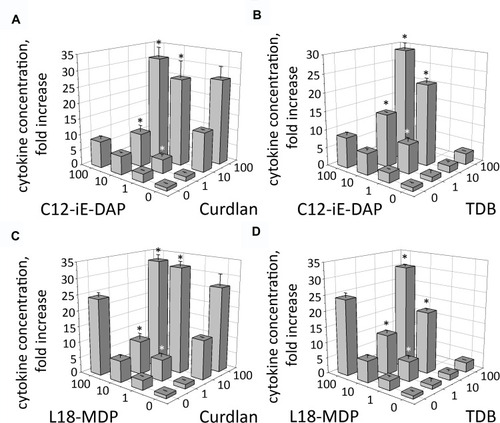
Figure 4 Potentiated proinflammatory response critically depends on RIP2- and Syk-mediated signaling after combined NOD1,2 and C-type lectin receptors stimulation. (A) NF-κB/AP-1-dependent SEAP activity in THP1-XBlue-CD14 cells treated for 18 h with Curdlan (10 μg/mL), TDB (10 μg/mL), C12-iE-DAP (1 μg/mL), L18-MDP (1 μg/mL) or their combinations without (alone) or with the inhibitors: gefitinib (5 μM), piceatannol (1 μg/mL), or DEX (200 μg/mL), as indicated. Results are expressed as the fold increase relative to intact (untreated) cells (values are mean from two independent experiments, each performed in triplicates). Error bars indicated standard deviations (SD). Asterisks *Indicate significant differences (P < 0.05) in SEAP activity between inhibitor-treated and untreated cells. (B) Concentrations of IL-8 in the culture supernatants of THP-1 cells treated with Curdlan (1 μg/mL), TDB (1 μg/mL), C12-iE-DAP (10 μg/mL), L18-MDP (10 μg/mL) or their combinations without (alone) or with inhibitors: gefitinib (5 μM), piceatannol (1 μg/mL), or DEX (200 μg/mL), as indicated. Data are presented as the means ± SD (error bars) from two independent experiments, each performed with triplicates. Asterisks *Indicate significant differences (P < 0.05) in cytokine production levels between inhibitor-treated and untreated cells.
Abbreviation: NS, not significant.
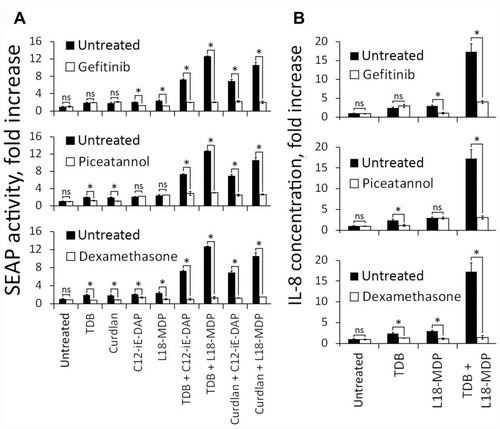
Figure 5 NF-κB-dependent luciferase activity in BALB/c-Tg(Rela-luc)31Xen transgenic mice after individual or combined i.m. injection of TDB (10 μg/mouse) and L18-MDP (1 μg/mouse). Control mice were injected with PBS. (A) Representative bioluminescent pseudocolored images of NF-κB-luciferase activity in live NF-κB-Luc transgenic mice 3 h after i.m. injection of PBS or PRR agonists alone or in combination. The intensity of bioluminescence (p/sec/cm2/sr) is shown in color according to the scale on the right. Two additional mice in each group gave similar results. (B) NF-κB-dependent bioluminescence in tissue homogenates prepared from the same mice. Results are expressed as the fold increase in relative luminescence units over PBS-treated control animals. Each bar represents the mean of three mice per group ± SD (error bars). Significant differences between PAMP-treated mice compared to the control mice receiving PBS injection are indicated by asterisks: *For p < 0.05 or **For p < 0.01. Significant differences between combined agonist administration and individual TDB or L18-MDP molecules are indicated by hashes and brackets: #For p < 0.05 or ##for p < 0.01 (Mann–Whitney U-test).
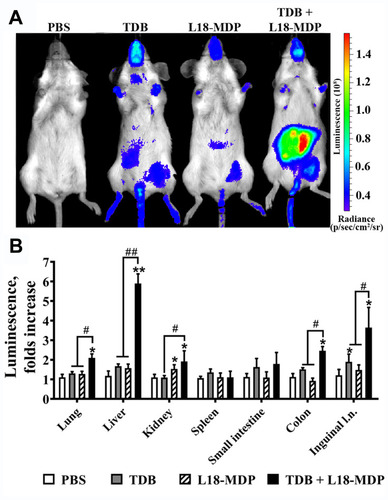
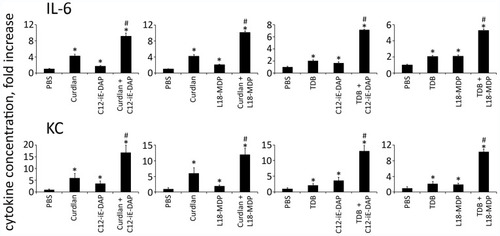
Figure 6 Combined stimulation of CLR and NOD receptors results in potentiation of cytokine production in mouse serum. Mice (n= 5 per group) were injected i.m. with PBS or with PRR agonists Curdlan (10 μg/mouse), TDB (10 μg/mouse), C12-iE-DAP (1 μg/mouse), L18-MDP (1 μg/mouse) individually or in combination: Curdlan-C12-iE-DAP, Curdlan-L18-MDP, TDB-C12-iE-DAP, TDB-L18-MDP. Blood samples were collected 3 h after PRR ligand administration. The mean fold change in cytokine concentration relative to the mean concentration in PBS-treated animals is shown. Error bars indicate SD. *Indicates significant difference (P≤ 0.05, Student’s t-test) between PRR agonist (individually or in combination) treated cells and the intact cells. #Indicates potentiated (greater than the sum of the fold induction observed after stimulation of single PRR at the same doses of agonists) cytokine production levels in group treated with combination of CLR and NOD agonists.