Figures & data
Table 1 Demographic Data
Figure 1 Representative images of neutrophils from cell migration stained with trypan blue and counted by automated cell counter (A), and the percentages of neutrophil chemotaxis of healthy donors (n=10) and patients with sepsis (n=10) (B). Representative flow cytometry results (C), and the percentages of phagocytic activity of healthy donors (n=5) and patients with sepsis (n=5) (D). Representative flow cytometry results (E), and the percentages of neutrophil apoptosis of healthy donors (n=5) and patients with sepsis (n=5) (F).
Notes: **p<0.01, ***p<0.005.
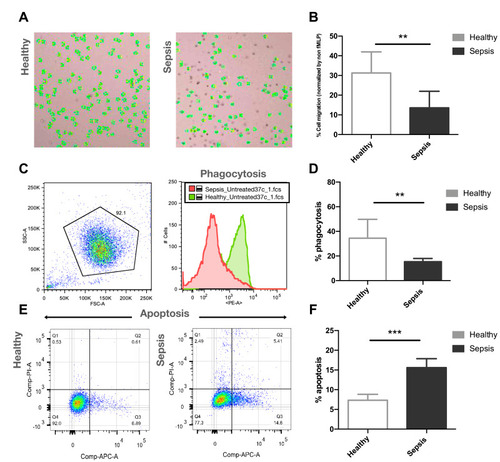
Figure 2 Representative fluorescence images (400X) of isolated neutrophils from healthy controls (n=20) and patients with sepsis (n=20), stained with DAPI (blue), elastase (green) and myeloperoxidase (red), and merged images for NET identification after 2h post-isolation ex vivo (A). Spontaneous NET formation after 2h post-isolation (B), the levels of dsDNA (C) and PADI4 mRNA expression (D) from healthy controls and patients with sepsis (n=10 for both groups).
Notes: *p<0.05, **p<0.01, ****p<0.001.
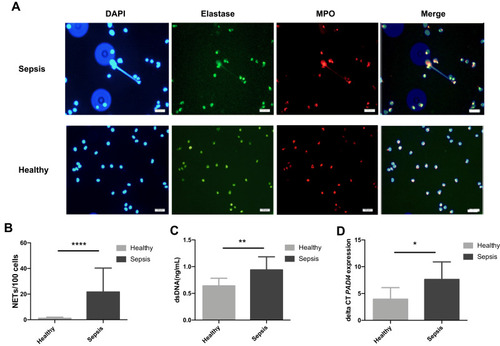
Figure 3 The percentages of neutrophil chemotaxis or cell migration (A), phagocytosis (B) and apoptosis (C) from healthy donors and patients with sepsis (n=5 for both groups) and the effect of ascorbate (1, 5, 10, 20 and 40 mM) on neutrophils after 2h treatment.
Notes: ****p<0.0001, ***p<0.001, **p<0.01, *p<0.05. ##p<0.01, ###p<0.005, ####p<0.001; when compared between groups.
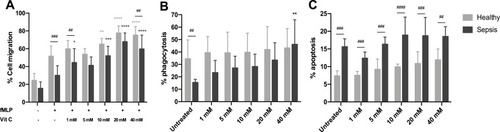
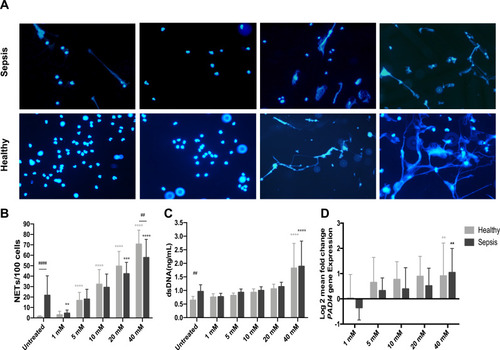
Figure 4 Effect of ascorbate on NET formation. Representative fluorescence images (400X) of isolated neutrophils from patients with sepsis and healthy controls treated with 1, 10 and 40 mM of ascorbate for 2h and stained with DAPI staining for NET identification (A). NETs counted per 100 neutrophils (n=20 for both groups) (B), the levels of dsDNA (C) and PADI4 mRNA expression (D) from patients with sepsis and healthy controls (n=10 for both groups) treated with different concentrations of ascorbate (1, 5, 10, 20 and 40 mM) for 2h.
Notes: ****p<0.0001, ***p<0.001, **p<0.01. ##p<0.01, ####p<0.001; when compared between groups.