Figures & data
Figure 1 HUMSC-Exos characterization. (A) Electron microscope image of collected HUMSC-Exos. (B) NTA analysis (n = 3 per group). (C) WB images of CD9, CD63, ALIX and TSG101.
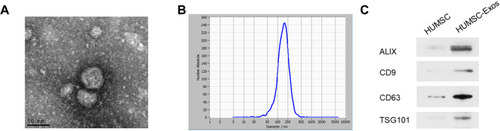
Figure 2 HUMSC-Exos inhibited rat fibroblast proliferation and fibrosis and promoted apoptosis. Rat fibroblasts were treated with HUMSC-Exos in the presence or absence of TGF-β1. (A) Cell proliferation (n = 5 per group). (B) Dead/live analysis (n = 5 per group). (C) Representative images of dead/live cells stained. Scale bar: 50 μm. (D) Cellular immunofluorescence images of COL III and α-SMA. Scale bar: 50 μm. (E) WB images of COL III and α-SMA. (F) Quantification of COL III and α-SMA (n = 3 per group). (G) Quantitative analysis of mRNA for COL III and α-SMA (n = 5 per group). *P < 0.05, **P < 0.01, ***P < 0.001.
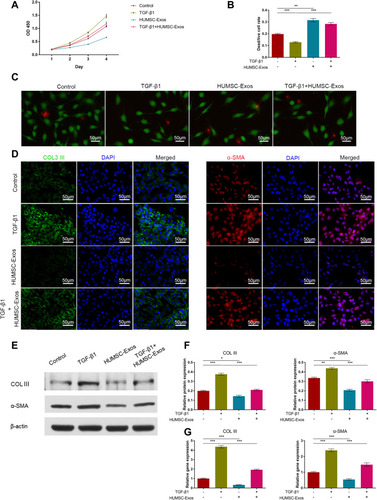
Figure 3 HUMSC-Exos inhibited tendon adhesion in rats. Rat tendon tissue from the sham, PBS and HUMSC-Exos groups was collected 3 weeks after surgery. (A) Macroscopic observation of tendons. (B and C) H&E staining of tendon sections. (D) Masson staining of tendon sections. (E) Adhesion grading score (n = 5 per group). (F) Maximum tensile strength (n = 5 per group). (G) Histology adhesion score (n = 5 per group). (H) Histological healing score (n = 5 per group). **P < 0.01, ***P < 0.001. (C and D) The arrows refer to adhesion tissues.
Abbreviation: ns, not significant.
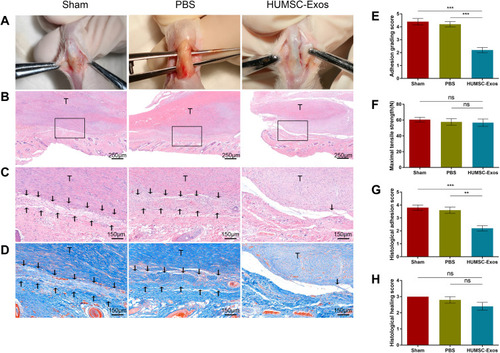
Figure 4 HUMSC-Exos synchronously inhibited rat tendon fibrosis and p65 activity. (A) Immunohistochemical staining of COL III and α-SMA. Scale bar: 75 μm. (B and C) Quantitative analysis of COL III and α-SMA (n = 6 per group). (D) WB images of COL III and α-SMA. (E) Quantitative analysis of mRNA for COL III and α-SMA (n = 5 per group). **P < 0.01, ***P < 0.001.
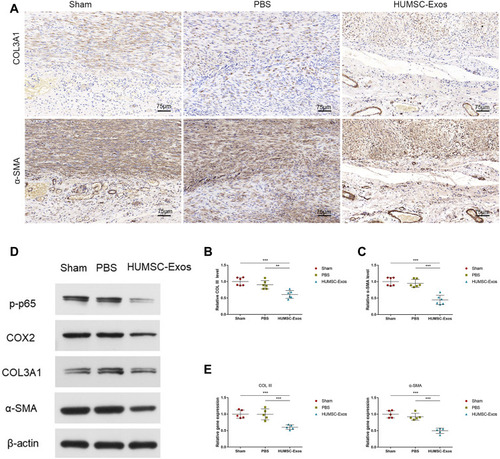
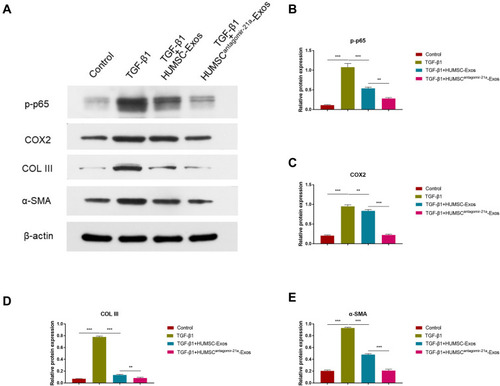
Figure 5 HUMSC-Exos expressed low abundance of miR-21a-3p. (A) The top 20 miRNAs with the most significant differences. (B) qPCR analysis of has-miR-21a-3p in HUMSCs and HUMSC-Exos (n = 5 per group). (C) qPCR analysis of rno-miR-21a-3p in tendon tissues from C HUMSC-Exos and sham groups (n = 5 per group). (D) The expression of has-miR-21a-3p determined by qPCR (n = 5 per group). ***P < 0.001.
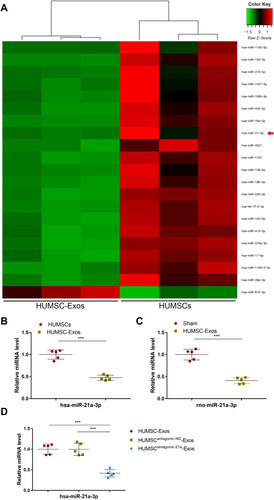
Figure 6 Engineered modification of HUMSC-Exos expanded inhibition of fibrosis. Rat fibroblasts were treated with HUMSC-Exos or HUMSCantagomir−21-Exos for 48 h in the presence or absence of TGF-β1. (A) WB images of p-p65, COX2, COL III and α-SMA. (B–E) Quantification of p-p65, COX2, COL III and α-SMA (n = 3 per group). **P < 0.01, ***P < 0.001.