Figures & data
Table 1 Characteristics of Patients with COVID-19 and Characteristics of the ALT Elevated Group in Comparison to the Normal Group of Patients with COVID-19
Figure 1 Distribution of ALT, AST, AST/ALT ratio, and LDH values among the elevated ALT and normal ALT patients with COVID-19. Each point in the diagrams show the values of the individual patients. Orange points belong to the elevated ALT patients and blue points to the normal ALT patients. The values of ALT, AST, AST/ALT ratio, and LDH of the elevated ALT patients were increased in comparison to the normal ALT patients (P-value < 0.05).
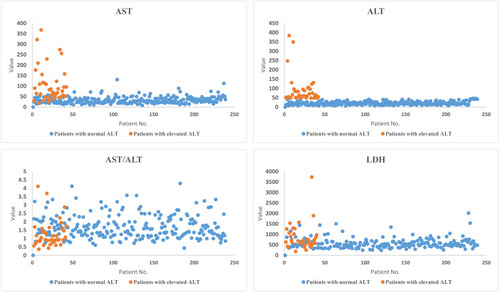
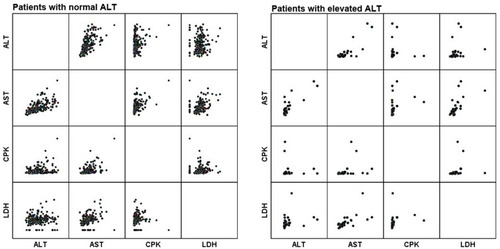
Figure 2 Correlation of the ALT, AST, CPK and LDH values with each other in patients with normal ALT and elevated ALT. The positive correlation was shown between the ALT and AST values in patients with elevated ALT, while the positivecorrelation between all values was shown with each other in patients with normal ALT.