Figures & data
Table 1 Criteria to Scale the Macroscopic Morphological Damage of the Colonic Mucosa
Figure 1 Macroscopic presentation of rat colons in treatment groups. Control (A) which shows intact colon, Colitis without treatment (B) which shows the highest level of tissue injuries like edema, erythema, ulcer, necrosis and thickening of tissue. Mastic oil: orally (C) and enema (D), prednisolone (E) and sesame oil (F) treated colons represents healing of ulcers and obvious improvement in tissue injuries.
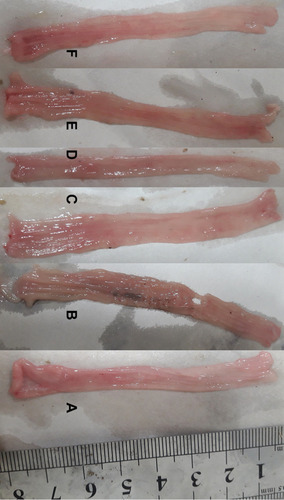
Figure 2 Gross morphology score in groups. *Normal tissues were significantly different compared with colitis (p=0.016) and prednisolone decreased gross score but statistically non-significant (p=0.057).
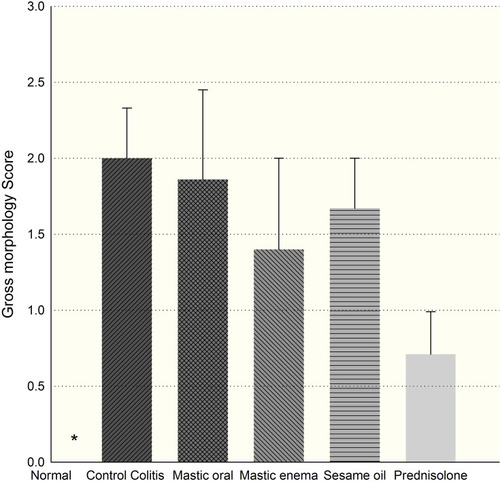
Figure 3 Effect of mastic oil (400 mg/kg) and prednisolone (5 mg/kg) shows on total colitis index. Data are analyzed as mean ± SD. *P<0.05 in comparison with colitis group.
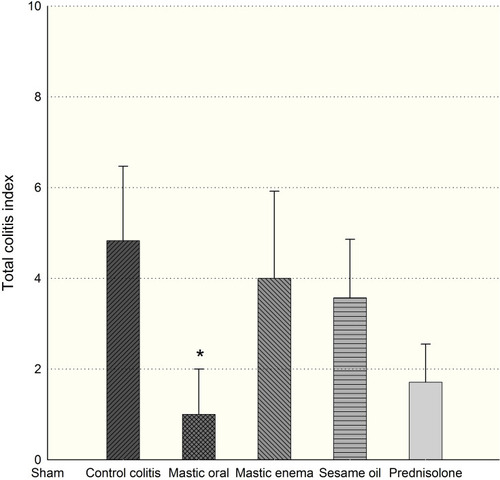
Table 2 Histopathological Characteristics Score in Different Groups, Mean Score (SD)
Figure 4 Microscopic section shows severe transmural acute inflammation with crypt and epithelium lost in colitis group. (Hematoxylin and Eosin, 100×).
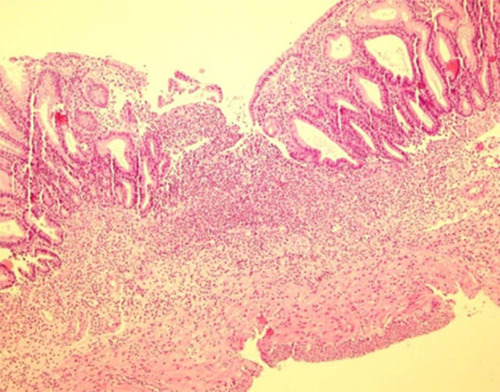
Figure 5 Microscopic section shows mild transmural acute inflammation with basal crypt damage and complete regeneration after mastic oil orally consumption. (Hematoxylin and Eosin, 100×).
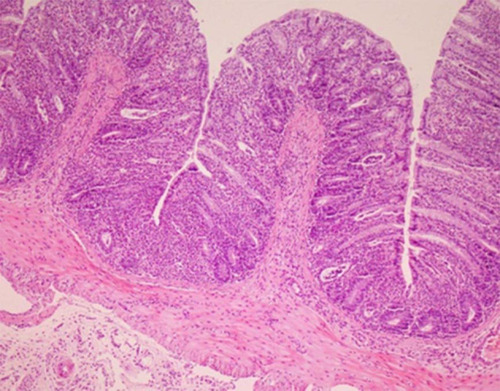
Figure 6 Effect of sesame oil and prednisolone (5 mg/kg) on MPO activity of rat colon. Data are analyzed as mean ± SD. *P<0.05 in comparison with colitis group.
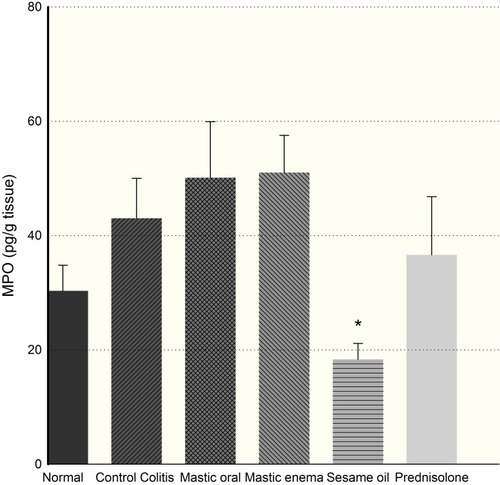
Figure 7 Effect of mastic oil (400 mg/kg) and prednisolone (5 mg/kg) on TNF-α. Data are analyzed as mean ± SD. *P<0.05, in comparison with colitis group.
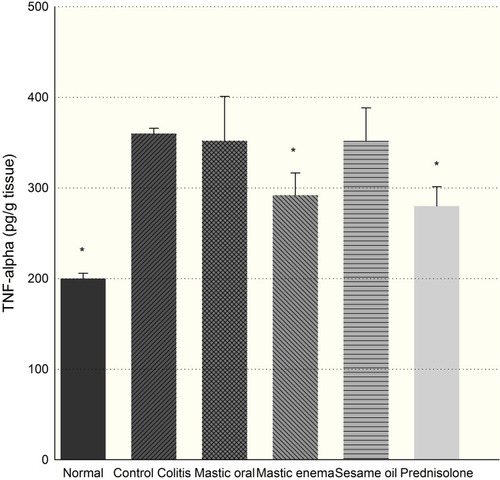
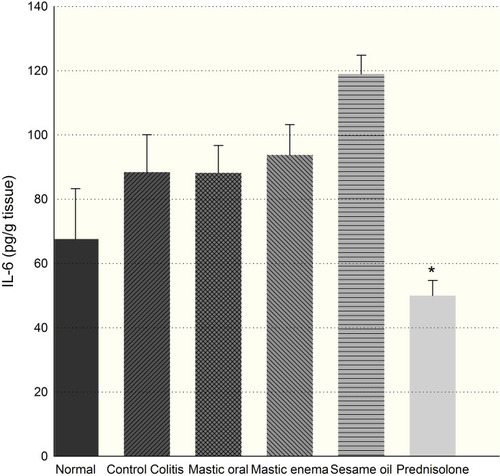
Figure 8 Effect of mastic oil (400 mg/kg) and prednisolone (5 mg/kg) on IL6. Data are analyzed as mean ± SD. *P<0.05 in comparison with colitis group.