Figures & data
Figure 1 Representative gating strategy – determination of the proportion of peripheral blood Treg cells expressing Helios. Peripheral blood mononuclear cells were obtained and processed as in the Patients and Methods section. During flow cytometry data analysis, lymphocytes were first identified based on their forward (FSC-H) and side scatter (SSC-H) (A). Contents of the lymphocyte gate were then analyzed for the presence of CD3 and CD4 markers and CD3+CD4+ T cells were gated (B). Then the contents of the CD3+CD4+ T cell gate were analyzed for the expression of CD25 and FoxP3 antigens and the cells displaying the CD3+CD4+CD25highFoxP3+ phenotype (Tregs) were delineated (C). Finally, the cells displaying the Treg phenotype were analyzed for the proportion of Helios+ cells ((D) sample stained with isotype control, (E) sample stained with anti-Helios antibody). Rounded rectangles mirror the actual gates used for analysis.
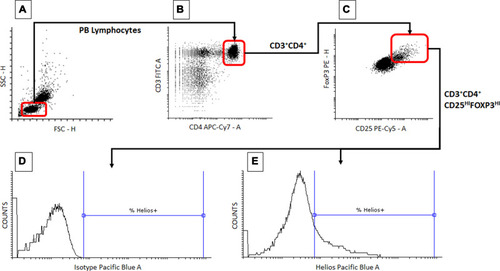
Table 1 Endoscopic and Clinical Findings in the Study Subjects
Figure 2 Circulating and intestinal Tregs in patients with inflammatory bowel disease. (A) Comparison of circulating Tregs between the studied and the control group. (B) Comparison of circulating Tregs between UC and CD patients. (C) Comparison of intestinal Tregs between the studied and the control group. (D) Comparison of intestinal Tregs between UC and CD patients. *Statistically significant difference. Individual results are shown as dots (●)/squares (■). Horizontal lines indicate median values. Circulating and intestinal Tregs are expressed as a percentage of CD4+ lymphocytes.
Abbreviations: IBD, patients with inflammatory bowel disease; C, control group; UC, patients with ulcerative colitis; CD, patients with Crohn’s disease; ns, not significant.
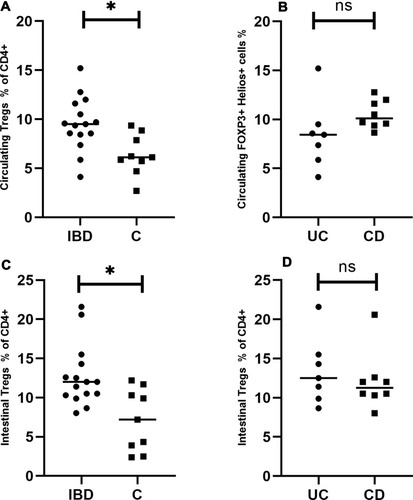
Figure 3 Comparison of circulating and intestinal Tregs in the studied group (left panel) and the control group (right panel). (A) Circulating and intestinal Tregs expressed as a percentage of CD4+ lymphocytes in the IBD group (left side) and the controls (right side). (B) Circulating and intestinal Helios+ Tregs expressed as a percentage of all Tregs in the IBD group (left side) and the controls (right side). (C) Circulating and intestinal Nrp-1+ Tregs expressed as a percentage of all Tregs in the IBD group (left side) and the controls (right side). *Statistically significant difference. Individual results are shown as dots (●)/squares (■). Horizontal lines indicate median values.
Abbreviations: IBD, patients with inflammatory bowel disease; C, control group; ns, not significant.
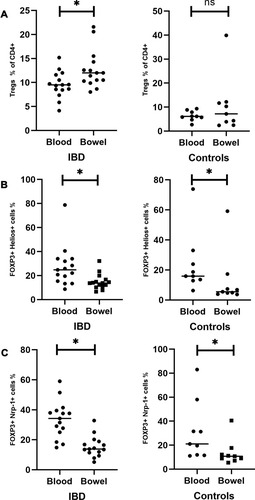
Figure 4 Circulating and intestinal Helios+ Tregs in patients with inflammatory bowel disease. (A) Comparison of circulating Helios+Tregs between the studied and the control group. (B) Comparison of circulating Helios+ Tregs between UC and CD patients. (C) Comparison of intestinal Helios+ Tregs between the studied and the control group. (D) Comparison of intestinal Helios+ Tregs between UC and CD patients. *Statistically significant difference. Individual results are shown as dots (●)/squares (■). Horizontal lines indicate median values. Helios+ Tregs are expressed as the percentage of all Tregs.
Abbreviations: IBD, patients with inflammatory bowel disease; C, control group; UC, patients with ulcerative colitis; CD, patients with Crohn’s disease; ns, not significant.
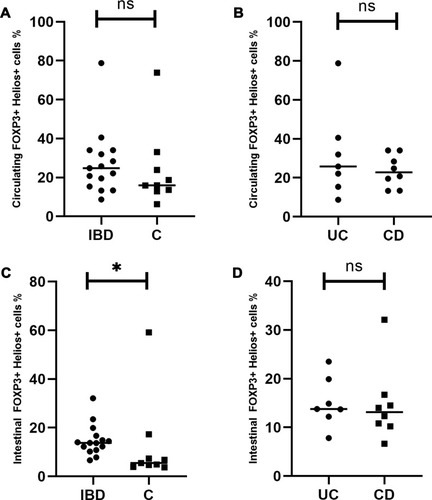
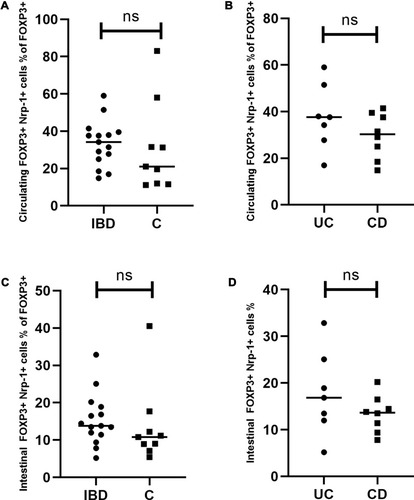
Figure 5 Circulating and intestinal Nrp-1+ Tregs in patients with inflammatory bowel disease. (A) Comparison of circulating Nrp-1+ Tregs between the studied and the control group. (B) Comparison of circulating Nrp-1+ Tregs between UC and CD patients. (C) Comparison of intestinal Nrp-1+ Tregs between the studied and the control group. (D) Comparison of intestinal Nrp-1+ Tregs between UC and CD patients. Individual results are shown as dots (●)/squares (■). Horizontal lines indicate median values. Neuropilin-1+ Tregs are expressed as the percentage of all Tregs.
Abbreviations: IBD, patients with inflammatory bowel disease; C, control group; UC, patients with ulcerative colitis; CD, patients with Crohn’s disease; ns, not significant.