Figures & data
Table 1 Demographics, Duration of Disease and Spirometry of Included Patients
Table 2 The Proportion of Induced Sputum Cells in Included Patients
Table 3 Demographics, Durationof Disease, Spirometry and Induced Sputum Features of CVA and CA
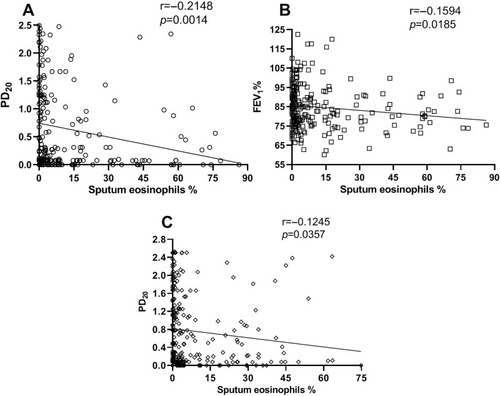
Figure 1 Scatter plots of correlation between the percentage of sputum eosinophils and PD20 (µg), FEV1%. (A) Correlation between the percentage of sputum eosinophils and PD20 in CA. (B) Correlation between the percentage of sputum eosinophils and FEV1% in CA. (C) Correlation between the percentage of sputum eosinophils and PD20 in CVA.