Figures & data
Table 1 Design of Experiments
Figure 1 The presence of inflammation focus in right hind limb of BALB/c mouse (A) and microsporidia detection in histological section of left hind limb muscle of BALB/c mouse 42 days post-infection (B) and right hind limb muscle SCID mouse 21 days post-infection (C) stained with Brown and Brenn Gram stain.
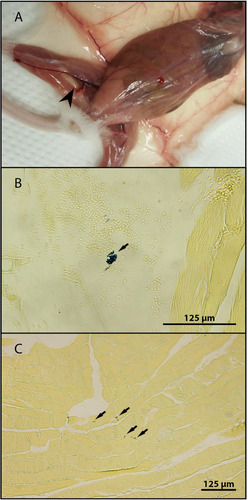
Figure 2 Maximum value of E. cuniculi spores per 1 gram of tissue (number in white fields) and frequency and spore burden of E. cuniculi spores per gram of tissue (colored squares; each square represents one mouse) in the BALB/c mice induced in acute (A) or chronic (B) phase of infection and SCID mice (C). aPeroral infection 107 spores of E. cuniculi genotype II in 200 µL dH2O and intramuscular injection of PBS; bPeroral infection 107 spores of E. cuniculi genotype II in 200 µL dH2O and intramuscular injection of Freund’s Incomplete Adjuvant; grey column – intramuscular injection of all animals in the group into the right thigh muscle; black column – intramuscular injection of all animals in the group into the left thigh muscle; * Significant difference between right and left leg; # Significant difference between control and experimental group; colored fields, positive capture of microsporidia in the sample according to the quantity scale.
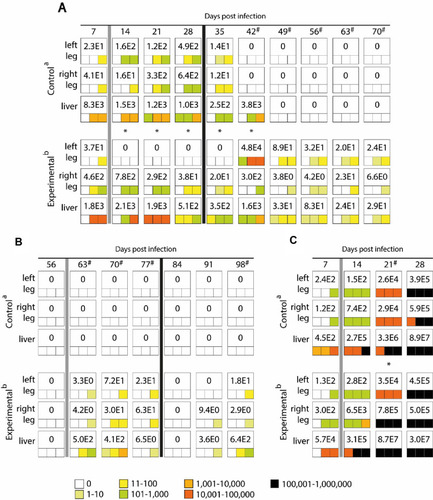
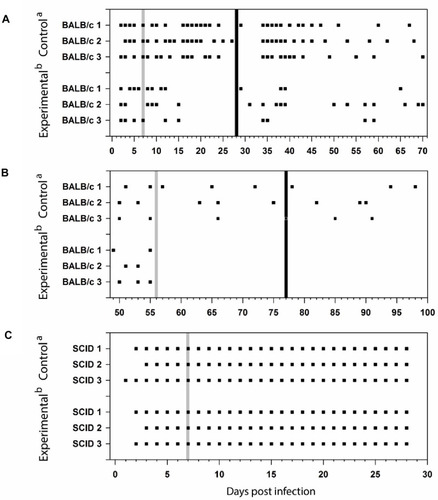
Figure 3 Encephalitozoon cuniculi DNA detection in feces of BALB/c mice induced in acute (A) or chronic (B) phase of infection and SCID mice (C). aPeroral infection 107 spores of E. cuniculi genotype II in 200 µL dH2O and intramuscular injection of PBS; bPeroral infection 107 spores of E. cuniculi genotype II in 200 µL dH2O and intramuscular injection of Freund’s Incomplete Adjuvant; grey column, intramuscular injection of all animals in the group into the right thigh muscle; black column, intramuscular injection of all animals in the group into the left thigh muscle; black square, positive capture of microsporidial DNA in the sample.