Figures & data
Figure 1 Immunohistochemistry assay for AQP1 and β-catenin expression in synovim of ankle joints from normal and CIA rats. Typical images of AQP1 (A) and β-catenin (B) expression in synovial tissues. High-power images (×400) show amplifications of regions boxed in blue in low-power images (×100). AQP1 and β-catenin were expressed at low levels in synovim from normal rats, whereas the relatively strong staining of AQP1 and β-catenin could be observed in CIA rats. (C) Percentages of AQP1 and β-catenin immune-positive cells in synovial tissues of normal and CIA rat. Data are mean ± SEM (n = 30). ##P < 0.01 compared with normal rat group.
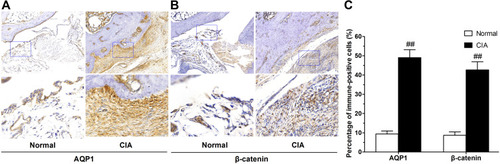
Figure 2 Western blot analysis for AQP1 and β-catenin protein in synovial tissues. (A) Typical examples of AQP1 and β-catenin protein expression in synovial tissues from normal and CIA rats. (B) The quantitative analysis of AQP1 and β-catenin protein relative values, β-actin serves as the house-keeping protein. Data are mean ± SEM (n = 6). ##P < 0.01 compared with normal rat group.
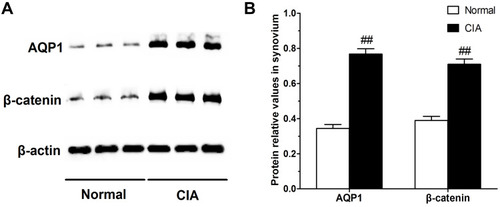
Figure 3 Correlations between synovial AQP1 positive cell percentage of CIA rats and secondary hind paw swelling (A) or total pathological score on joint damage (B) or synovial β-catenin positive cell percentage (C). The correlation analysis is performed by Pearson’s correlation test (n = 30) and asterisks (*) show the statistical significance. **P <0.01.
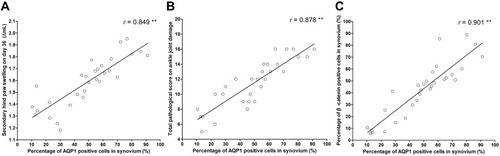
Figure 4 AQP1 siRNA effectively reduced AQP1 protein level in cultured CIA FLS. (A) FLS identification by VCAM-1 expression using immunofluorescence staining (×200). (B) Protein bands and quantitative analysis of AQP1 in normal and CIA FLS. (C) Protein bands and quantitative analysis of AQP1 from non-treated CIA FLS, NC siRNA-transfected CIA FLS and AQP1 siRNA-transfected CIA FLS. β-actin serves as the house-keeping protein. ##P < 0.01 compared with normal FLS group. **P <0.01 compared with CIA FLS group. The data are mean ± SEM of three independent experiments performed in triplicate.
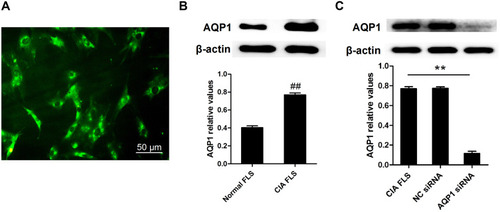
Figure 5 Inhibition of CIA FLS proliferation by AQP1 siRNA was abolished by LiCl. (A) The cell viability of different FLS groups, detected by MTT assay. (B) Typical photos of PCNA immunofluorescence staining from different FLS groups (×100). (C) Quantitative statistical results of PCNA-positive cells (%). The data are mean ± SEM of three to five independent experiments performed in triplicate. ##P < 0.01 compared with normal FLS group. **P < 0.01 compared with CIA FLS group. &&P < 0.01 compared with AQP1 siRNA group.
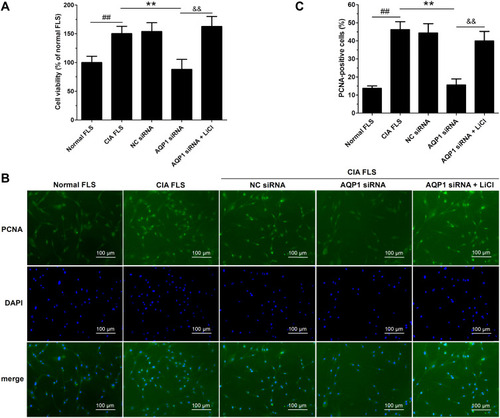
Figure 6 Suppression of CIA FLS migration and invasion by AQP1 siRNA was canceled by LiCl. (A) Typical photos of cells that crossed the membrane coated without or with matrigel, measured by transwell assay for detecting migration or invasion (×100). (B) Histogram shows numbers of migrated cells per microscopic field. (C) Histogram shows numbers of invasive cells per microscopic field. The data are mean ± SEM of three independent experiments performed in triplicate. ##P < 0.01 compared with normal FLS group. **P <0.01 compared with CIA FLS group. &&P < 0.01 compared with AQP1 siRNA group.
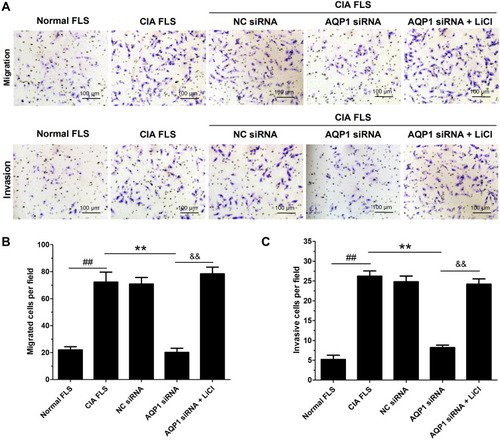
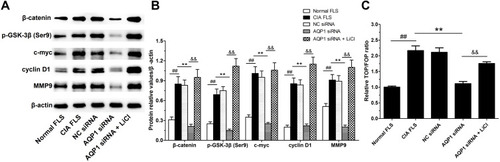
Figure 7 AQP1 siRNA inhibited the activation of β-catenin signaling in CIA FLS. (A) The protein expressions of β-catenin signaling pathway members such as β-catenin, p-GSK-3β (Ser9), c-myc, cyclin D1 and MMP9, detected by Western blot analysis. (B) The quantitative analysis of protein relative values, β-actin serves as house-keeping protein. (C) The ratio of TOP/FOP, an indicator of the activity of TCF/LEF transcription factors. The data are mean ± SEM of three independent experiments performed in triplicate. ##P < 0.01 compared with normal FLS group. **P <0.01 compared with CIA FLS group. &&P < 0.01 compared with AQP1 siRNA group.