Figures & data
Figure 1 The H&E staining of representative liver tissues in experimental mice. (HE×200). (A) Normal mouse liver. (B) CCl4 treated mouse liver. (C) Bifendate treated mouse liver (200 mg/kg). (D) Hyp-L (low dose, 50 mg/kg). (E) Hyp-H (high dose, 100 mg/kg).
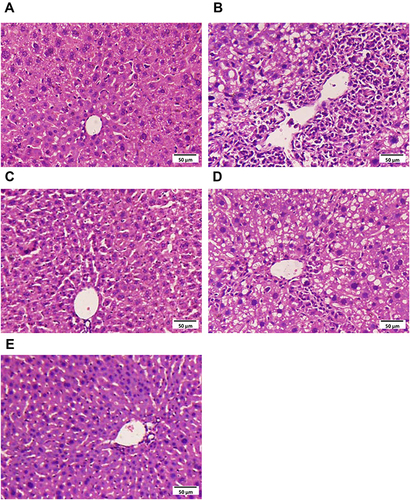
Table 1 Effect of Hyp on Serum AST and ALT Levels and Liver MDA, SOD and GSH Activities in Acute Liver Injury Mice Induced by CCl4
Figure 2 The effect of Hyp on MDA, ROS and HO-1 levels in the L02 cells induced by H2O2. Liver cells were pretreated with Hyp (50, 100, 200 μM) or tBHQ (50 μM) for 24 h and then treated with or without H2O2 (100 μM) for one hour. Effect of Hyp on MDA (A) and ROS (B) levels in L02 cells treated with H2O2 (n=6); L02 cells were cultured with increasing concentrations of Hyp for 24 h or 200 μM of Hyp for 0–24 h, HO-1 mRNA levels were analyzed by RT-PCR. Dose-effect (C) and time-effect (D) of Hyp on HO-1 expression in L02 cells treated with H2O2; β-actin was used as loading control for each lane. Scanning densitometry was used for semi-quantitative analysis by comparison with control groups (graphs of A and B). (E) Relative luciferase activity was examined by the dual-luciferase reporter assay system. The luciferase activity was normalized against untreated cells with plasmid transfection. *P<0.05, **P<0.01 compared with normal control cells; ***P<0.05, ****P<0.01 compared with H2O2 treated cells.
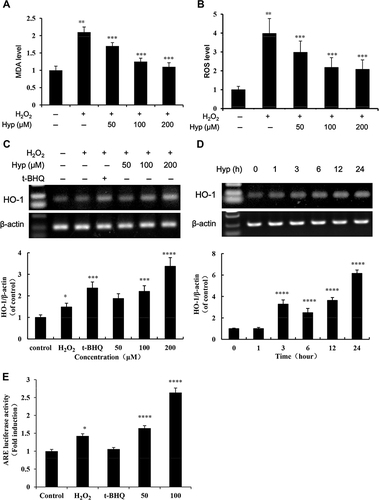
Figure 3 The effects of Hyp on Nrf2 and Bach1 in L02 cells induced by H2O2. (A) Dose-dependent effect of Hyp on the mRNA levels of Nrf2 and Bach1 in L02 cells. (B) Time-dependent effect of Hyp on the mRNA levels of Nrf2 and Bach1 in L02 cells. (C) The effects of Hyp on protein expression of Nrf2 in L02 cells. (D) The effects of Hyp on nuclear translocation of Nrf2 in L02 cells (without H2O2 treatment). H2O2: 100 μM, *P<0.05 compared with normal control cells; **P<0.05, ***P<0.01 compared with the H2O2 treated cells.
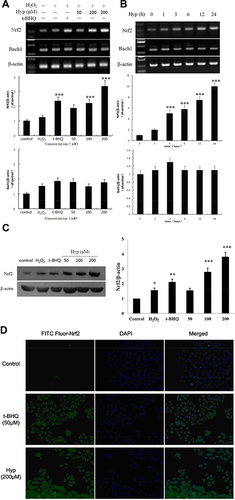
Figure 4 The effects of Hyp on Bach1 total protein expression and subcellular localization in L02 cells. Dose-dependent effect (A) and time-dependent effect (B) of Hyp on the protein expression of Bach1 in L02 cells. Time-dependent effect (C) and dose-dependent effect (D) on the subcellular localization of Bach1 in L02 cells. (E) The effects of Hyp on nuclear translocation of Bach1 in L02 cells. *P<0.05, **P<0.01 compared with control cells.
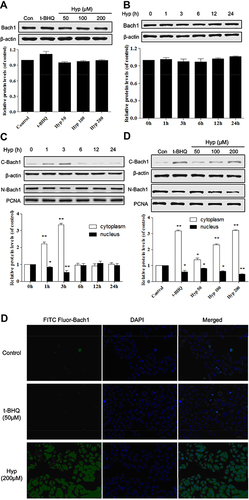
Figure 5 The effects of Hyp on the combination of Nrf2, Bach1 and ARE in L02 cells. (A) Hyp treatment for three hours. (B) Hyp treatment for 24 h. *P<0.05 Nrf2 compared with negative control group cells. **P<0.05 Bach1 compared with negative control group cells.
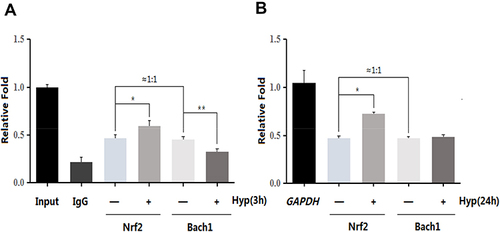
Figure 6 The effects of Hyp on Bach1 and Crm1 in L02 cells. (A) The effect of LMB on the protein expression of Bach1 in L02 cells. (B) The effect of GEN on the protein expression of Bach1 in L02 cells. (C) The effect of LMB on the protein expression of HO-1 in L02 cells. (D) The effect of GEN on the protein expression of HO-1 in L02 cells. (E) Dose-dependent effect of Hyp on the protein expression of Crm1 and MafK in L02 cells. (F) The effect of Hyp on the cell viability of L02 cells in the presence of H2O2 and LMB or GEN. H2O2: 100 μM. *P<0.05, **P<0.01 compared with control group or LMB/GEN group, ***P<0.05, ****P<0.01 as compared with t-BHQ group, #P<0.05, ##P<0.01 as compared with Hyp group.
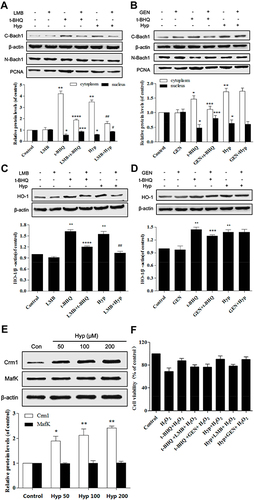
Figure 7 Relative protein levels in L02 cells pretreated with Hyp. (A) The effect of Hyp on the protein expression of p38, p-p38, erk1/2 and p-erk1/2 in L02 cells. (B) The effect of SB203580 or U0126 on Hyp-induced expression of Crm1 and nuclear export of Bach1. *P<0.05, **P<0.01 compared with control cells. ***P<0.05, ****P<0.01 compared with Hyp group cells.
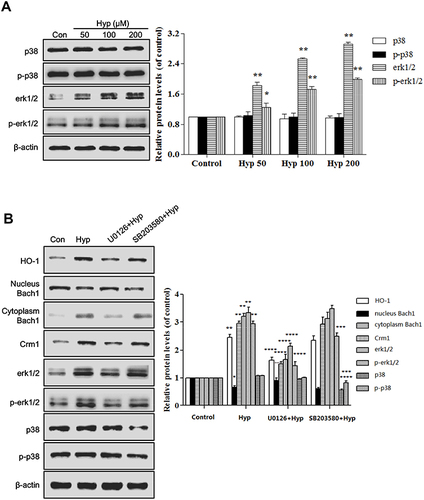
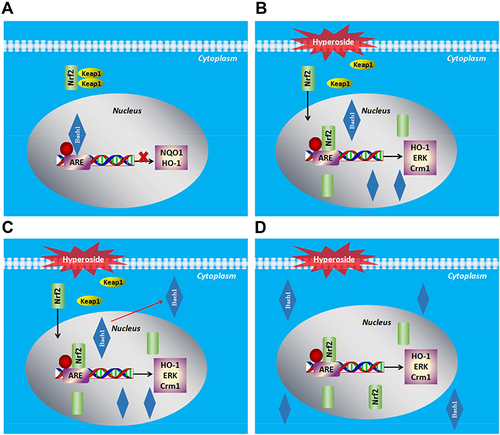
Figure 8 Diagrammatic representation of effect of Hyp on Bach1 and Nrf2. (A) Normal conditions; (B–D) After oxidative stress, Hyp promotes the nuclear accumulation of Nrf2 and the nuclear export of Bach1, and thus contributes to the activation of their target genes Crm1 (XPO1) and HO-1 (HMOX1).