Figures & data
Figure 1 Flow cytometric detection of regulatory B cells.
Notes: (A) Forward and side scatter histogram was used to define the lymphocytes population (R1). (B) The CD19+ cells (R2) were assessed within the lymphocyte population. (C) The expression of CD24 and CD38 was assessed in CD19+ cells to define CD19+CD24+highCD38+high cells (regulatory B cells).
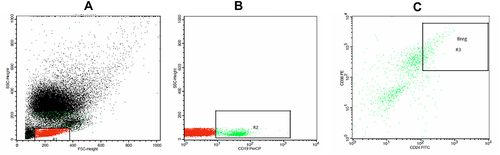
Table 1 Clinical and Immunological Characteristics of the Study Subjects
Table 2 DMARDs Administration in BD Patients
Table 3 The Differences in Total B Lymphocytes and B Regulatory Subset with Different Disease Characteristics
Figure 2 The relationship of B lymphocytes with ESR and BSAS scores.
Abbreviations: ESR, erythrocyte sedimentation rate; BSAS, Behçet’s Syndrome Activity Score.
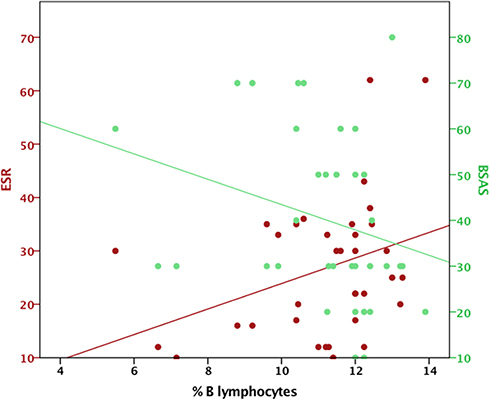
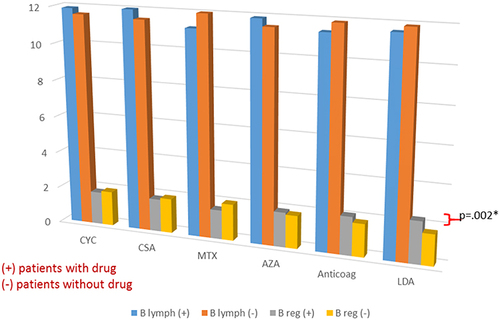
Figure 3 The differences in medians of total B lymphocytes and B regs. Percentages with versus without different drug administration. *Significant difference.
Abbreviations: CYC, cyclophosphamide; CSA, cyclosporine-A; MTX, methotrexate; AZA, azathioprine Anticoag; anticoagulant; LDA, low dose aspirin.