
Figures & data
Table 1 Baseline Characteristics of COVID-19 Patients
Figure 1 Epidemic curve for the COVID-19 outbreak. Epidemic curve of laboratory-confirmed cases of the COVID-19 outbreak by date of symptom onset (deep blue line), hospital admission date (light blue line), and discharge date (orange line) in Shenzhen, China, collected from January 11th to February 11th 2020. In total, 214 patients were admitted to hospital and 176 of them were discharged from the hospital.
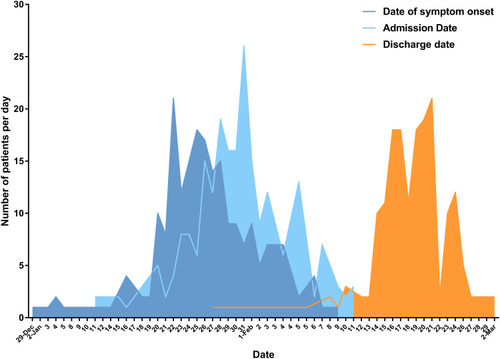
Figure 2 Changes in laboratory parameters before admission. (A) Lymphocyte counts shown by days since onset of symptoms. Critical patients presented severe lymphocytopenia with significantly declined cell count (p<0.01) when the symptoms lasted for 6 days without seeking professional medical care. (B) Bar graphs showing the average duration of hormone therapy between patents grouped by interval from symptom onset to admission day. (C, D) Average lymphocyte count and serum albumin (ALB) level in patients experiencing more than one week of symptoms. Critical patients had significantly lower lymphocyte numbers (C) and ALB concentration (D) compared with severe patients (p=0.0062, p=0.0009, respectively). The pink line/bar represents moderately ill patients, the purple line/bar represents severely ill patients, and the blue line/bar represents critically ill patients. Error bars represent mean ± SEM; **p<0.01.
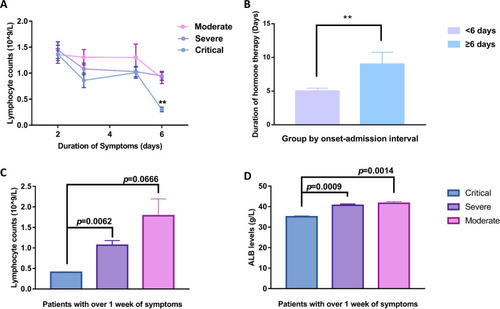
Figure 3 Time course of lymphocyte counts and serum biochemical levels during hospitalization. (A) Comparison of lymphocyte counts indicated that significantly lower average levels existed from day 3 to day 18 of admission in critical patients. The reduced average counts changed to an increase from day 9 of admission in both critical and severe patients. Correlation analysis on the mean lymphocyte counts of severe patients showed a significant linear increased trend (R2=0.924, p=0.038) from day 9 to day 18, represented as a red regression line, while the linear increase in mean lymphocyte count in critical patients was extremely significant from day 9 to day 39, represented as an orange regression line (R2=0.972, p<0.001). (B) The average of serum ALB levels showed an apparently fall, whereas it was significantly higher in severe patients during the initial 9 days of hospital stay. (C, D) The inflammatory markers IL-6 and CRP showed a dramatic increase, with extremely high values in critical patients, whereas there was a relatively small change in severe patients during hospitalization. Mean ± SEM; *p<0.05; **p<0.01; ***p<0.001.
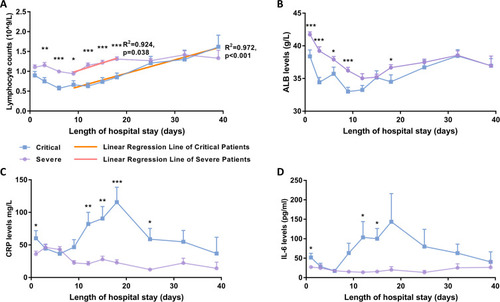
Figure 4 Temporal dynamics in viral negative-conversion rate and immune status of COVID-19 patients. (A) Viral negative conversion rate detected by RT-PCR in nasopharyngeal swabs from COVID-19 patients stratified by disease severity. The blue line represents critically ill patients, the purple line represents severely ill patients, and the pink line represents moderately ill patients. The thick lines show the trend of viral negative conversion rate over different time points during hospitalization, using smoothing splines. Further regression analysis (B–D) identified correlations between lymphocyte count and PCR negative conversion rate in critical (B) and severe (C) illness groups, but not in the moderate group (D). Error bars represent mean ± SEM.
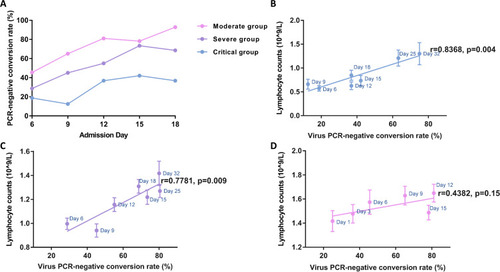
Table 2 Correlation Analysis Between Immunological Manifestations and Clinical Outcomes on Admission Days 9 and 12