
Figures & data
Figure 1 Flow chart of the participants.
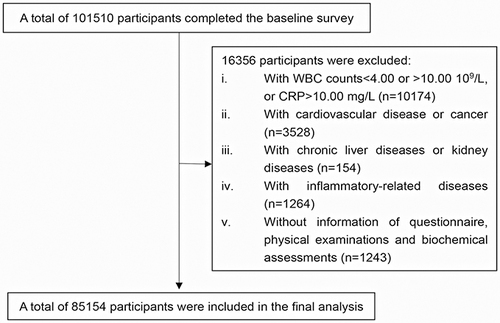
Table 1 Baseline Characteristics of Subjects (n=85,154)
Table 2 Hazard Ratios of Stroke, Subtypes of Stroke, MI, All-Cause Mortality According to Quantiles of SII
Figure 2 (A–C) The Kaplan–Meier curves for 10-year incident of stroke (A), myocardial infarction (B), and all-cause mortality (C) by quartiles of SII. (D–F) The Kaplan–Meier curves for 10-year incident of stroke (D), myocardial infarction (E), and all-cause mortality (F) by quartiles of SIRI. The cumulative hazard risk was calculated according to the multiple Cox regression adjusted for age, gender, BMI, smoking, drinking, education, marriage, income level, physical activity, family history of cardiovascular disease, TG, HDL-C, a history of hypertension and type 2 diabetes.
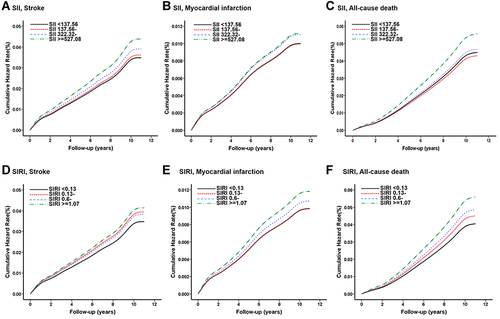
Table 3 Hazard Ratios of Stroke, Subtypes of Stroke, MI, All-Cause Mortality According to Quantiles of SIRI