Figures & data
Figure 1 The flow chart of the experiment. After one week acclimation (-D7 to D0), 26 rats were given 5% DSS water for 7 days and then subjected to the surgical placement of stimulation electrodes and EMG electrodes (10 rats for EMG electrodes only, 16 rats for both EMG electrodes and stimulation electrodes). After a 5-day recovery, the rats were treated with initial EA on different days with different parameters. To wash out the effects of initial EA, the rats were given a 3-day rest and then repetitive daily EA was performed for 2 weeks. Rats in the normal group (n=6) were only subjected to the surgical placement of EMG electrodes.
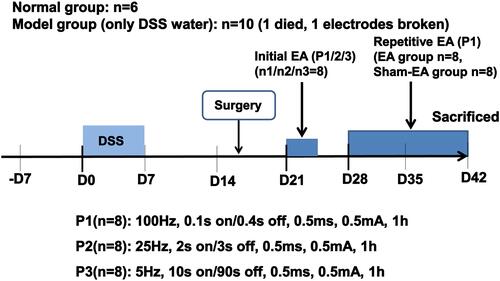
Figure 2 Effects of initial EA with different parameters on abdominal EMG and AWR (abdominal withdraw reflex) in response to colorectal distention in DSS-treated rats. (A) Abdominal EMG tracings in three different sessions in a DSS-treated rat (a: EA with parameter P1; b: EA with P2 and c: EA with P3). (B) EMG responses to colorectal distention in three different sessions (a–c). (C) AWR in responses to colorectal distention in three different sessions (a–c). Only with the parameter P1, EA decreased the abdominal EMG (from 40 to 60 mmHg) and AWR responses to colorectal distention at a pressure of 20 to 60 mmHg. EA with parameter P2 (“b” in the figure) or P3 (“c”) was not effective in suppressing the abdominal EMG and AWR responses to colorectal distention. *P<0.05 after EA vs before EA.
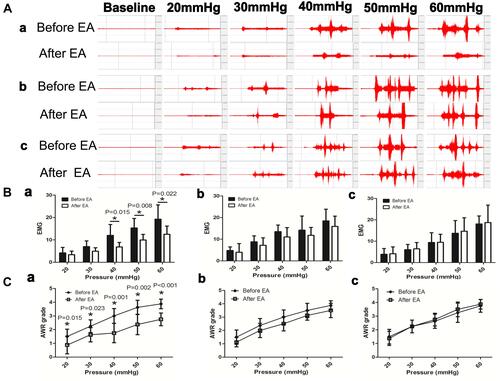
Figure 3 Effects of repetitive EA on EMG and AWR in rats after recovery from inflammation. (A) EMG responses to colorectal distention in different groups of rats. Normal: no treatment; Model: treated with DSS; EA: treated with DSS and then 2-weeks of daily EA; Sham-EA: same as EA but without electrical stimulation. (B) The total area under curve (AUC) of EMG under all distention pressures in different groups of rats. (C) AWR scores under different pressures of colorectal distention. (D) The total AWR score under all distention pressures in different groups of rats. *P<0.05, Model vs Normal. #P<0.05, EA vs Sham-EA.
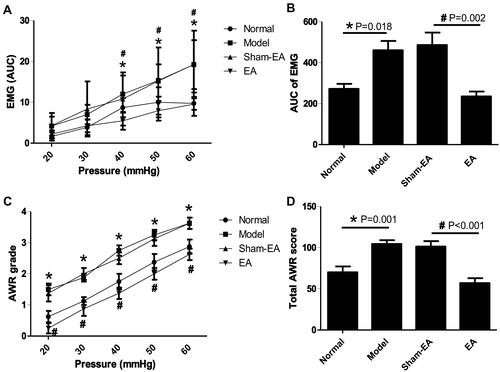
Figure 4 Expressions of collagen fibers in the distal colon in different groups. (A) Masson’s trichrome staining of the distal colon in each group. The collagen fiber was showed in blue, while the myofiber was shown in red (10×). (B) Quantitative expressions of collagen fibers in different groups of rats. *P<0.05.
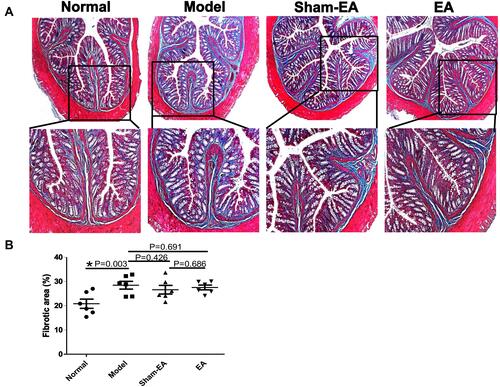
Figure 5 Expression and degranulation of mast cells in the distal colon in different groups of rats. (A) The expression of mast cells (tryptase+ cells) and the co-localization of mast cells (tryptase+ cells) and nerve endings (PGP9.5+ cells). Arrows indicate the tryptase+ cells. White stars show the connections between mast cells and nerves. Scale bar=50 μm. (B) Quantitative expressions of tryptase+ cells in different groups of rats. *P<0.05. (C) Toluidine blue staining of the distal colon with dark-violet-colored mast cells in a blue background (40×). Degranulated mast cells are noted with the presence of granules (indicated by white arrows). (D) Quantitative expressions of activated mast cells in different groups of rats. *P<0.05.
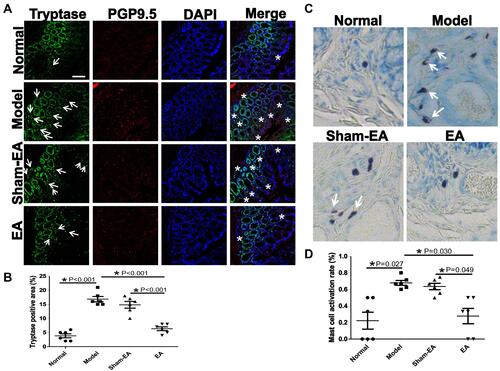
Figure 6 Expressions of NGF/TrkA proteins in the distal colon in different groups. (A) The expression of TrkA in the mucosa of each group. Scale bar=50 μm. (B) Quantitative expressions of TrkA+ area in different groups of rats. *P<0.05. (C) The expression of TrkA and NGF protein in different groups. (D and E) Quantitative expressions of TrkA and NGF proteins in different groups, respectively. *P<0.05.
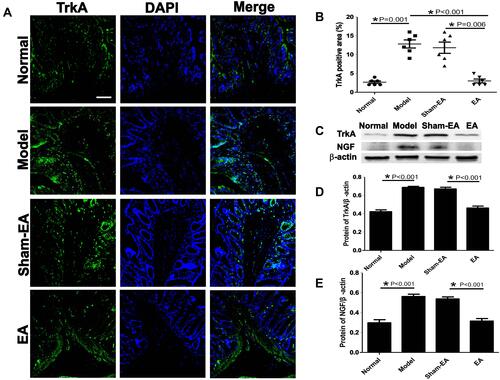
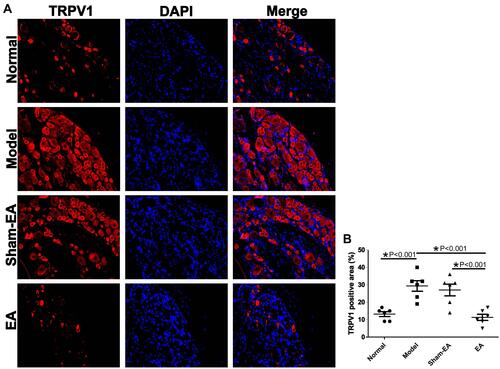
Figure 7 Effects of EA on the expressions of TRPV1 (green) and PGP 9.5 (red) in the distal colon in different groups. (A) The expression of TRPV1+ PGP 9.5+ neurons in the submucosal layer and myenteric plexus of the colonic wall. Arrows indicate the location of TRPV1+ PGP 9.5+ neurons. Scale bar=50 μm. (B) The quantitative expression of TRPV1+ PGP 9.5+ neurons in different groups. *P<0.05.
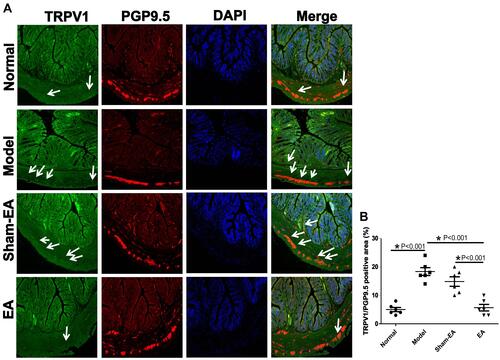
Figure 8 Effects of EA on the expression of TRPV1 in S2-S3 dorsal root ganglions (DRGs). (A) The expression of TRPV1+ ganglion cells in different groups. Scale bar=50 μm. (B) The quantitative expression of TRPV1+ ganglion cells in different group. *P<0.05.