Figures & data
Table 1 Sequences of Primer Sequences Used in Quantitative Reverse Transcription-Polymerase Chain Reaction
Table 2 Antibodies Used for Western Blot Analysis
Figure 1 miR-21 promotes post-myocardial infarction (MI) cardiac fibrosis and negatively impacted cardiac function. (A) Expression profile of miR-21 at 2 weeks post-MI; ***P < 0.001, n = 5 per group. (B–E) Knockout (KO) of miR-21 decreases the expression of TGF-β, α-SMA, FAP and Col-Iα at 2 weeks post-MI; ****P<0.0001 compared with WT sham, ####P<0.001 compared with wild-type (WT) MI, n = 5 per group. (F) KO of miR-21 decreases the expression of inflammatory cytokines at 2 weeks post-MI; ***P < 0.001 compared with WT sham, #P < 0.05 compared with WT MI, n = 5 per group. (G) Quantitative analysis of collagen content between WT and miR-21 KO mice at 2 weeks post-MI based on Masson’s trichrome staining; *P < 0.05, n = 3 per group. (H) Representative Masson’s trichrome and H&E staining of the cross section of the heart. The representative illustration indicates that miR-21 KO attenuates both replacement fibrosis and interstitial fibrosis in the infarct border zone. (I and J) Representative immunofluorescence staining of α-SMA and FAP in the heart; scale bars = 100 µm. (K and L) Western blotting analysis of α-SMA and FAP in WT and miR-21 KO mice myocardium. Left panel (K), representative blots; right panel (L), quantitative analysis; ns = not significant, ***P < 0.001 and ****P < 0.0001, n = 3 per group. (M and N) Representative (M) and quantitative analysis of cardiac functions at 2 weeks post-MI (N); ns = not significant, *P < 0.05 and **P < 0.01 compared with WT sham, #P < 0.05 and ##P < 0.01 compared with WT MI, n = 4 per group.
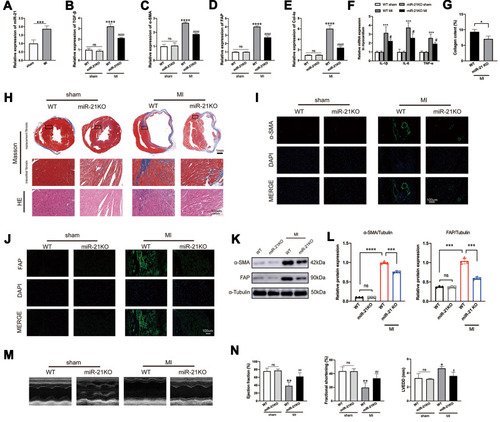
Figure 2 miR-21 promotes angiotensin II (Ang II)-induced myofibroblast transformation in vitro. (A–C) Western blotting analysis of myofibroblast markers in wild-type (WT) and miR-21 knockout (KO) primary cardiac fibroblasts (CFs) treated with or without Ang II. Left panel (A), representative blots; right panel (B and C), quantitative analysis; *P < 0.05 and ****P < 0.0001, n = 3 per group. (D) Representative immunofluorescence staining image of α-SMA and FAP in WT and miR-21 KO primary CFs treated with or without Ang II. Scale bar = 100 µm.
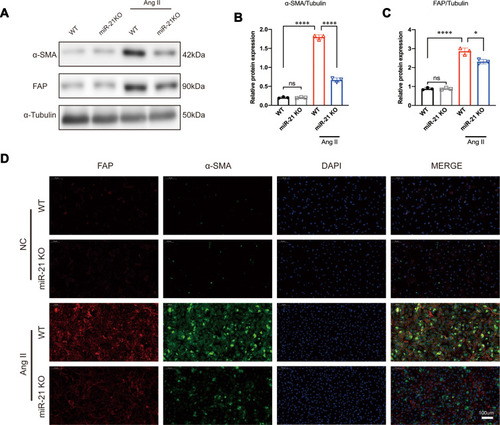
Figure 3 Knockout of miR-21 partially reverses angiotensin II (Ang II)-induced ERK/TGF-β/Smad activation. (A) Representative and (B–E) quantitative analysis of Western blots of miR-21 knockout (KO) on Ang II-induced ERK/TGF-β/Smad signaling in primary cardiac fibroblasts (CFs). Ang II induces the activation of ERK/TGF-β/Smad signaling in primary CFs. This effect could be reversed by the KO of miR-21. ***P < 0.001, ****P < 0.0001, n = 3 per group.
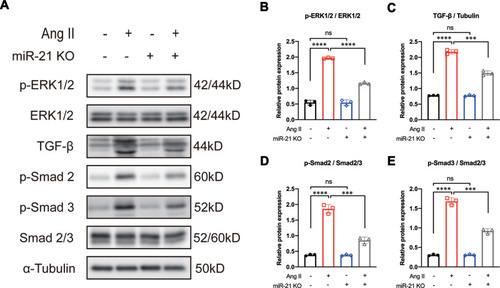
Figure 4 Sprouty1 (Spry1), an miR-21 target, inhibits the activation of ERK1/2 post-myocardial infarction (MI). (A) Relative expression of Spry1 between wild-type (WT) and miR-21 knockout (KO) mice at 2 weeks post-MI; ****P < 0.0001, n = 5 per group. (B–D) Representative (B) and quantitative Western blots (C and D) of Spry1, p-ERK, and ERK in WT and miR-21 KO mice myocardium; miR-21 KO mice that underwent MI induction exhibited increased expression of Spry1 and decreased expression of p-ERK1/2. Inhibition of Spry1 promotes the phosphorylation of ERK1/2. ***P < 0.001, ****P < 0.0001, n = 3 per group.
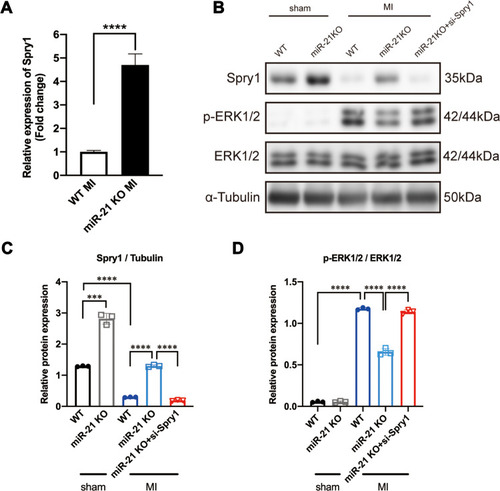
Figure 5 Inhibition of Sprouty1 (Spry1) reverses the effect of miR-21 knockout (KO) on angiotensin II (Ang II)-induced ERK/TGF-β/Smad activation in primary cardiac fibroblasts (CFs). (A) Representative and (B–H) quantitative analysis of Western blots. Inhibition of Spry1 reverses the effects of miR-21 KO on Ang II-induced ERK/TGF-β/Smad signaling in primary CFs; *P < 0.05, **P < 0.01, ***P < 0.001, ****P < 0.0001, n = 3 per group.
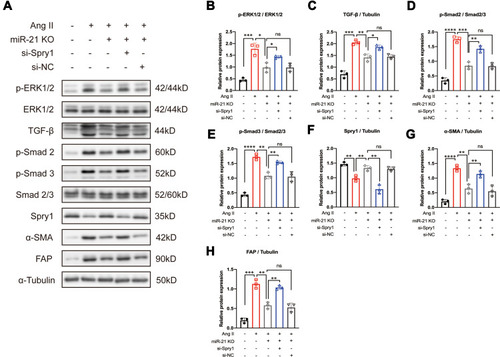
Figure 6 Inhibition of Spry1 reverses the effects of miR-21 knockout (KO) on post-myocardial infarction (MI) cardiac fibrosis. (A) Representative Masson’s trichrome and hematoxylin and eosin (H&E) staining of the cross section of the heart. The image shows that the inhibition of Spry1 reverses the effects of miR-21 KO on both replacement fibrosis and interstitial fibrosis post-MI. (B) Quantitative analysis of collagen content (%) between the groups shown in (A); *P < 0.05, **p < 0.01, n = 3 per group. (C) Representative Western blotting and (D–F) quantitative analysis of fibrotic markers in mice myocardium subjected to MI; ****P < 0.0001, n = 3 per group.
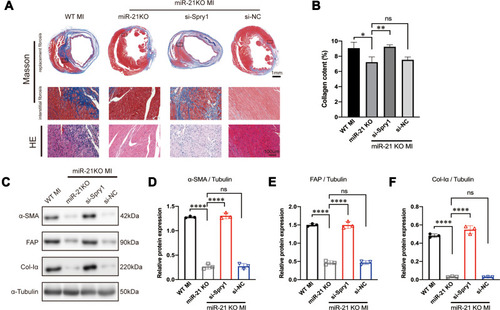
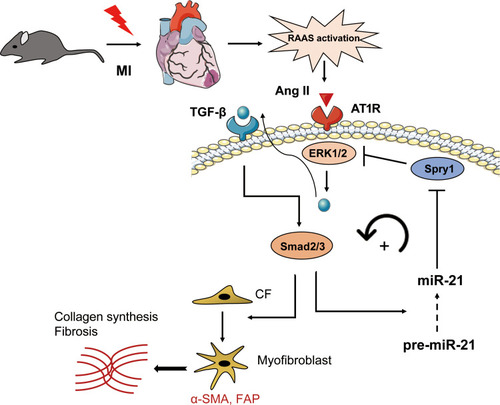
Figure 7 Schematic representation of the mechanisms by which miR-21 promotes post-MI cardiac fibrosis.