Figures & data
Figure 1 Semi-quantitative scoring system for histological evaluation of MN in mice. (A) Typical images of normal and atrophic glomerulus (pointed by yellow arrow). (B) The scoring of mesangial expansion (ME) from 1 to 4. 1: 0–24% of the area affected with densely stain, normal to minimal; 2: 25–49%, mild; 3: 50–74%, moderate; and 4: >75%, severe.
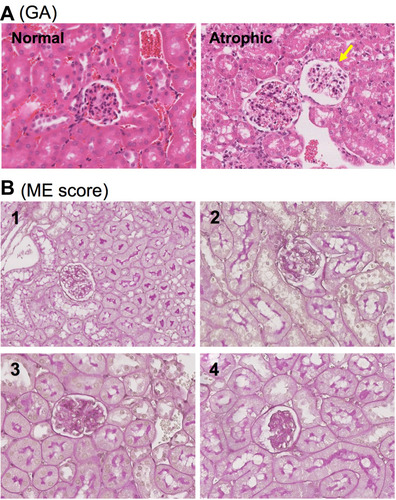
Figure 2 The changes of kidney function after cBSA immunization in CLU-KO mice. The parameters of kidney function was determined at day 50 after initial cBSA immunization. (A) Serum creatinine (SCr), *p = 0.2646 (cBSA-WT vs PBS-WT); **p < 0.0001 (cBSA-KO vs cBSA-WT). (B) Blood urea nitrogen (BUN), there was no statistically significant difference between groups. p = 0.5769 (cBSA-WT vs PBS-WT); p = 0.8011 (cBSA-KO vs cBSA-WT). (C) Urinary protein. *p = 0.6495 (cBSA-WT vs PBS-WT); **p = 0.0181 (cBSA-KO vs cBSA-WT). Each value presents the measure of one animal.
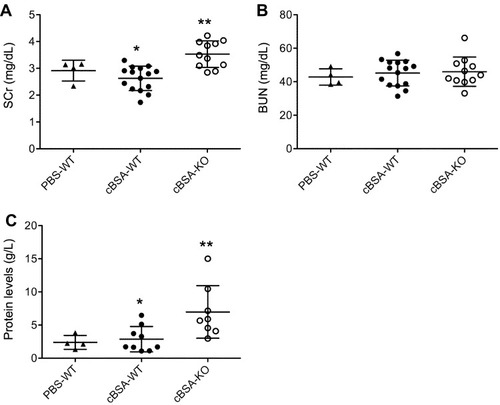
Figure 3 The severity of glomerular injury after cBSA immunization in CLU-KO mice. The severity of glomerular injury was determined in kidney sections by using semi-quantitative histological analyses. (A) Typical microscopic images of the renal cortex of mice in cBSA-WT and cBSA-KO groups. The tissue sections were PAS stained. A: artery, yellow star: glomerulus. Scale bar: 80 µm. (B) Glomerular atrophies (GA), the numbers of atrophic glomeruli in a high-powered field (hpf) of HE-stained sections. Each value presents the number of each mouse. *p = 0.2567 (cBSA-WT vs PBS-WT); **p < 0.0001 (cBSA-KO vs cBSA-WT). (C) Mesangial expansion (ME) was scored according to the PAS staining of thickening basement membrane or ECM deposit along the outer surface of the basement membrane. Each value presents the average score of 180 to 250 glomeruli of one animal. *p = 0.5974 (cBSA-WT vs PBS-WT); **p = 0.0026 (cBSA-KO vs cBSA-WT).
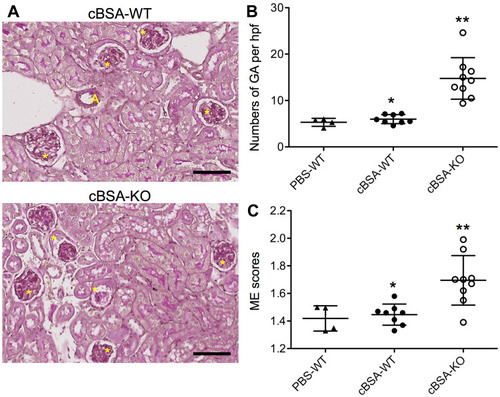
Figure 4 The glomerular deposit of Igs and C3 in mice after cBSA immunization in CLU-KO mice. The glomerular expression of CLU, Igs or C3 was detected by using immunohistochemical staining. Upper panel: CLU protein. Red arrow: capsular epithelium. Middle panel: Igs. Bottom panel: C3. G: glomerulus, PT: proximal tubule, A: artery. Data are presented in a typical microscopic image of immunohistochemical staining of each target protein. Brown color: positive staining. Scale bar: 80 µm.
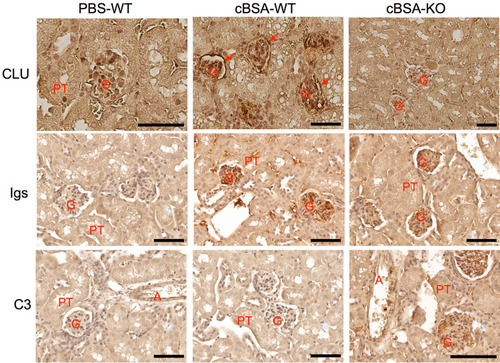
Figure 5 Serum levels of anti-cBSA IgG and C3 after cBSA immunization. The serum anti-cBSA IgG subclasses and C3 were measured in PBS-WT (n = 3), cBSA-WT (n = 12) or cBSA-KO (n = 11) by using ELISA. (A) IgG1 was measured in the serum samples serially diluted from 1:50,000. p = 0.7822 (cBSA-KO vs cBSA-WT); p < 0.0001 (PBS-WT vs cBSA-WT). (B) IgG2a was measured in the serum samples serially diluted from 1:200. p = 0.1141 (cBSA-KO vs cBSA-WT); p < 0.0001 (PBS-WT vs cBSA-WT). (C) C3 was measured in the serum samples serially diluted from 1:200. p = 0.1783 (cBSA-KO vs cBSA-WT); p = 0.4792 (PBS-WT vs cBSA-WT).
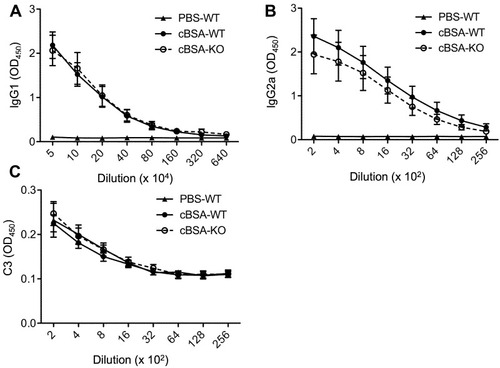
Table 1 CLU-Bound Proteins
Figure 6 Serum CLU in WT mice. The serum proteins (15 µL per lane) were fractioned in 10% SDS-PAGE. (A) Coomassie blue staining of protein fractions. (B) CLU protein was detected by Western blot analysis.
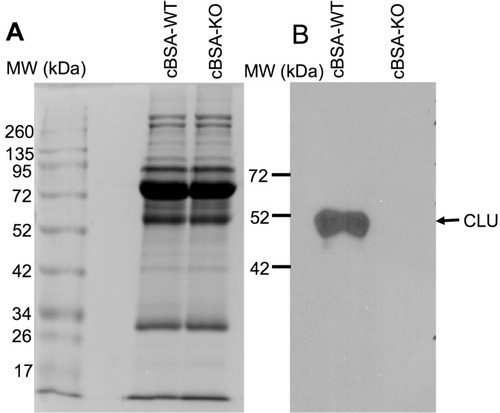
Figure 7 CLU-bound proteins in the serum of mice after cBSA immunization. Serum CLU and its bound proteins were immunoprecipitated by using anti-CLU antibodies. (A) A typical Coomassie blue staining of fractions of immunoprecipitate in 10% SDS-PAGE. Arrow: the protein bands of interest for LC-MS analysis. (B) Western blot analysis of CLU protein in the immunoprecipitate. * The heavy chain of anti-CLU antibody. (C) Western blot analysis of anti-cBSA IgG in the immunoprecipitate, in which the immunoprecipitates were used as first antibody in the detection of cBSA in the blot. Data present a typical stained PAGE or Western blot of three separate experiments.
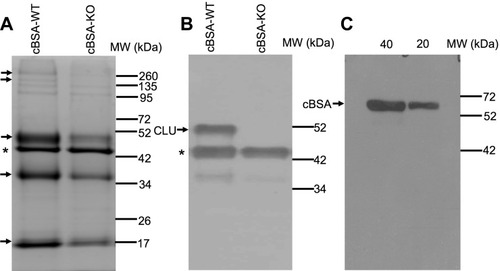
Figure 8 Serum antibody-binding on the cell surface of cultured heat-sensitive mouse podocytes (HSMPs). Serum samples were diluted 1:100, and the levels of serum antibody-binding to the cell surface of HSMSs were determined by using FACS analysis. (A) A typical FACS histograph of serum antibody-binding. Dote line: Background staining. Solid line: antibody-binding levels. (B) Each value presents the measure of one animal (n = 7). p = 0.3784 (cBSA-KO vs cBSA-WT).
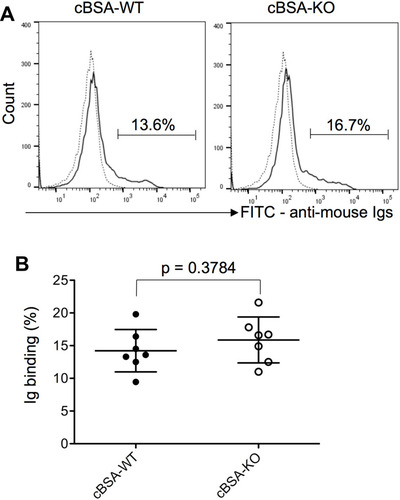
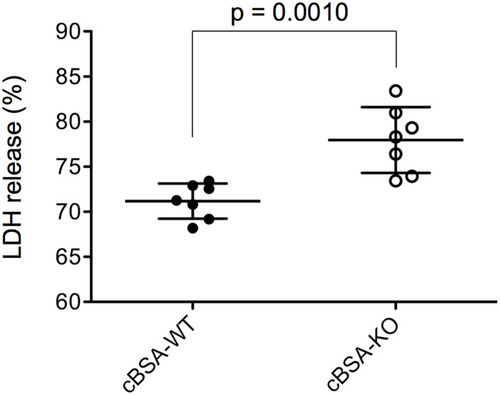
Figure 9 Effect of CLU in serum on CDC after cBSA immunization. The CDC against cultured HSMSs in the presence of 1:100 diluted serum was measured by the percentage of LDH release. Each value presents the measure of one animal (n = 7). p = 0.0010 (cBSA-KO vs cBSA-WT).