Figures & data
Table 1 Sequences of Primers Used for qRT-PCR
Table 2 Precursor and Product Ions of Constituents in Guizhi-Shaoyao-Zhimu Decoction
Figure 1 Result of the HPLC-Q-TOF-MS/MS analysis of the water extracts of GSZD. (A) MS-BPC spectrogram (positive and negative mode). (B) Compounds in water extracts of GSZD identified by the HPLC-Q-TOF-MS/MS assays.
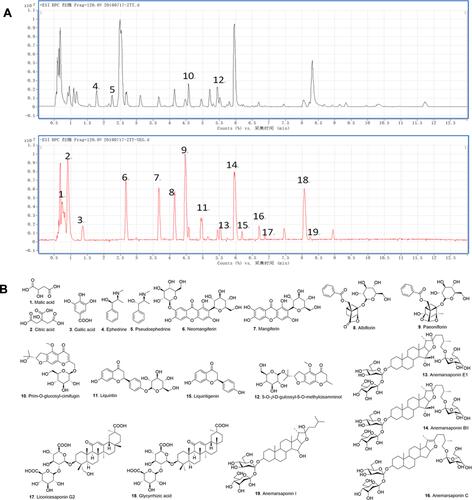
Figure 2 Flowchart of the study strategy and overlapped targets screen. (A) Flowchart of the analysis strategy in the study. (B) The volcano plot of the differentially expressed genes in microarray data sets of GSE55457, GSE55235, and GSE1919. The vertical axis represents log 2 FC (fold change) and the horizontal axis represents log 10 (p-value). (C) Heatmap of differentially expressed genes (DEGs) in microarray data sets of GSE 55457, GSE55235, and GSE1919. The vertical axis represents the sample. The horizontal axis represents DEGs. (D) Overlap of the genes by DEGs and predicted targets. Magenta circle is the predictive gene of 11 potential active compounds in GSZD (653), the blue circle is the DEGs in synovial tissue of RA patients and normal patients (574), and the overlap in the middle is the overlapping genes between the two genes (83). (E) PPI network of the screened targets. (F) The top 20 hub genes in the PPI network were selected according to the node degree.
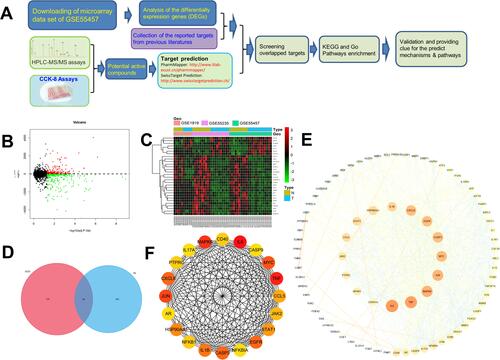
Figure 3 Effects of the main constituents in GSZD on proliferation of MH7A cells. Data were expressed as mean ±SD (n=3).
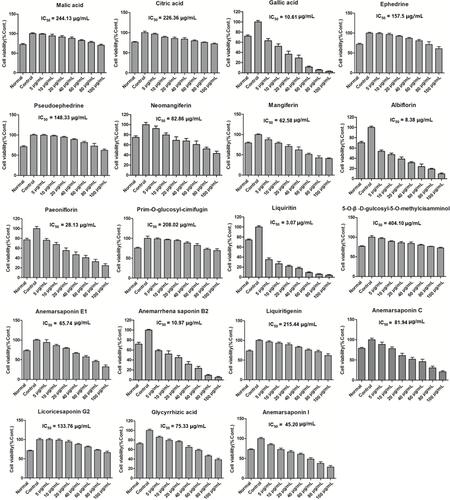
Table 3 GO Enrichment Analysis Results of Overlapping Genes (OGs)
Figure 4 GO functional enrichment analysis represented in bar chart (A), bubble diagram (B) and clustering dendrogram (C). Log FC means fold change of log value.
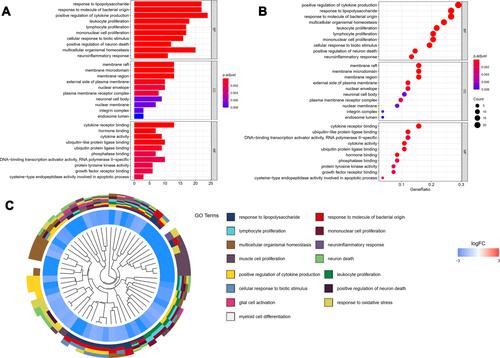
Table 4 KEGG Enrichment Analysis Results of Overlapping Genes (OGs)
Figure 5 KEGG functional enrichment analysis represented in bar chart (A), bubble diagram (B) and clustering dendrogram (C).
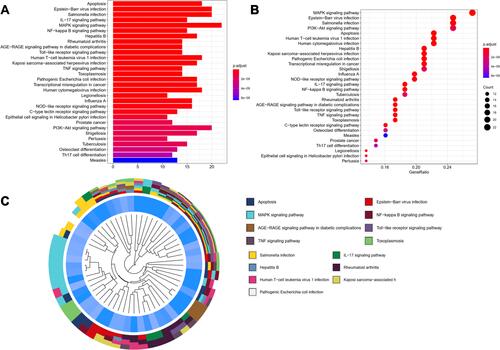
Table 5 Network Topology Parameters of Active Compounds in GSZD
Figure 6 Network analysis of targets and active compounds. The data pairs of active compounds and disease target genes were input into Cytoscape software to construct the drug-target network diagram (DTN).
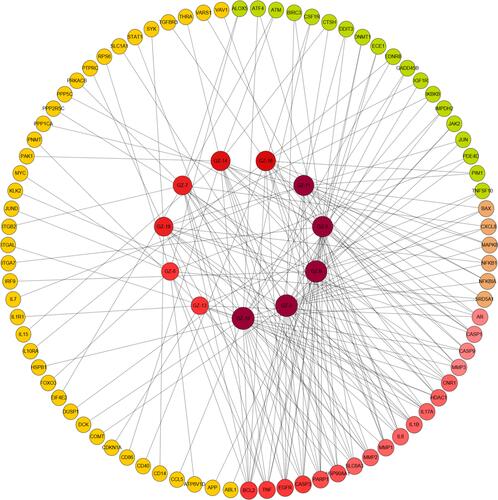
Figure 7 Effect GSZD on nuclear transcription of NF-κB. Cell morphology was determined by DAPI (blue) and antibody of NF-κB p65 (Red) under a laser confocal microscope (200×). The arrows represented the NF-κB in cell nucleus.
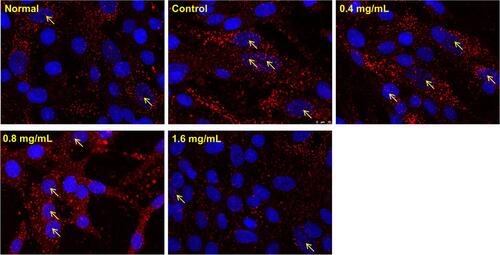
Figure 8 Effects of GSZD on the inflammation related genes (A) and proteins (B) in TNF-α stimulated MH7A cells. Data were expressed as mean ±SD (n=3), *p<0.01, vs control.
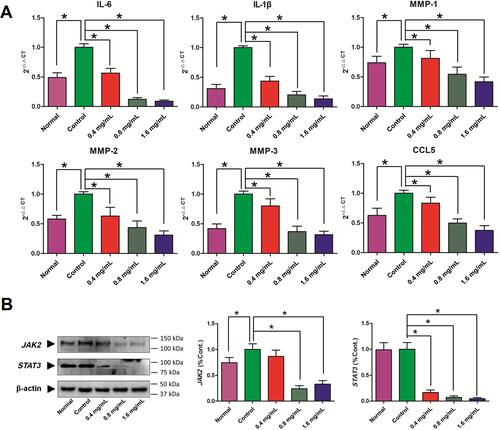
Figure 9 Effect GSZD on the membrane potential and apoptosis of the TNF-α induced MH7A cells. (A) After GSZD intervention, the mitochondrial membrane potential (MOMP, ΔΨm) change, the green fluorescence indicates that the MOMP of cell is at a normal level, while red fluorescence indicates that the MOMP of cell is decreased. ΔΨm was measured using a MOMP detection kit (JC-1) and observed using a laser confocal microscopy (100×), (B) Apoptosis was measured using flow cytometry staining with annexin V-FITC/PI. Data were expressed as mean ±SD (n=3), *p<0.01, vs normal group.
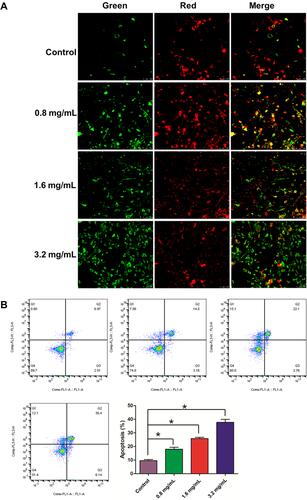
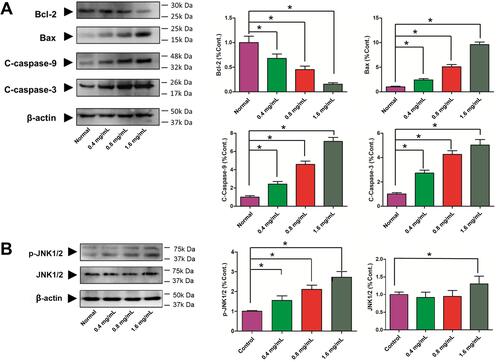
Figure 10 Effects of GSZD on apoptosis related proteins. (A) Proteins expressions of Bcl-2, Bax, cleaved (C)-caspase-3, and cleaved (C)-caspase-9 by Western blot assay. (B) Protein expressions of JNK and phosphorylation (P) of JNK by Western blot assay. Data were expressed as mean ±SD (n=3), *p<0.01, vs normal group.