Figures & data
Figure 1 Experimental schedule.
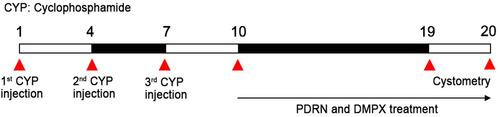
Table 1 Histological Score
Table 2 Primary and Secondary Antibodies in Western Blot
Figure 2 Voiding functions. (A) The inter-contraction pressure, contraction pressure and time change as recorded by cystometry. (B) Comparison of inter-contraction interval in each group. (C) Comparison of contraction pressure in each group, (D) Comparison of contraction time in each group. *Indicates P < 0.05 when compared with the control group. #Indicates P < 0.05 compared with the IC-induced group.
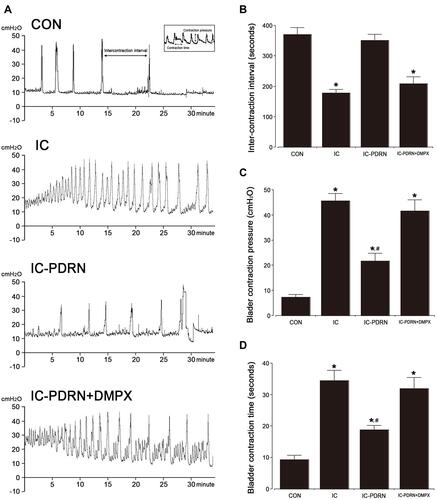
Figure 3 Ratio of bladder weight to body weight and inflammatory score. (A) Histological changes in the bladder tissue. (B) Ratio of bladder weight to body weight in each group. (C) Inflammatory score in each group. Black arrows indicate epithelial detachment, erosion, and inflammatory cells. Blue arrows indicate edematous stroma and irregularly ectasia vessels. *Indicates P < 0.05 when compared with the control group. #Indicates P < 0.05 compared with the IC-induced group.
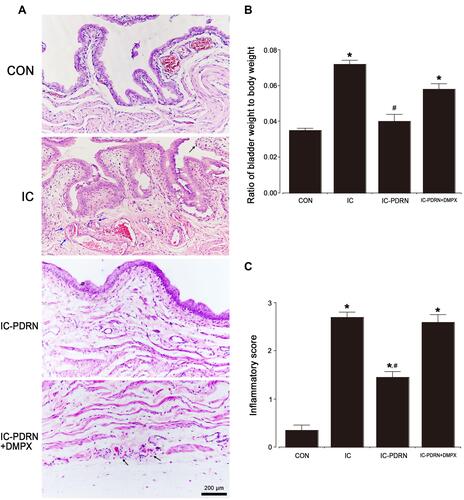
Figure 4 Pro-inflammatory cytokines. Left: Tumor necrosis factor (TNF)-α level in the bladder tissue. Right: Interleukin (IL)-1β level in the bladder tissue. *Indicates P < 0.05 when compared with the control group. #Indicates P < 0.05 compared with the IC-induced group.
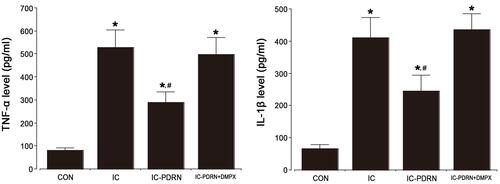
Figure 5 Nnuclear factor (NF)-κB, NF-κB inhibitor-α (IκB-α), and cascade factors of mitogen-activated protein kinase (MAPK). Upper left panel: Representative expressions of NF-κB, NF-κB inhibitor (IκB)-α, extracellular signal-regulated kinase (ERK), c-Jun N-terminal kinase (JNK), p-38. Upper right panel: Relative expression of NF-κB and relative ratio of phosphorylated IκB-α (p-IκB-α) to IκB-α. Lower panel: Relative ratio of phosphorylated ERK (p-ERK) to ERK, phosphorylated JNK (p-JNK) to JNK, and phosphorylated p-38 (p-p-38) to p-38. *Indicates P < 0.05 when compared with the control group. #Indicates P < 0.05 compared with the IC-induced group.
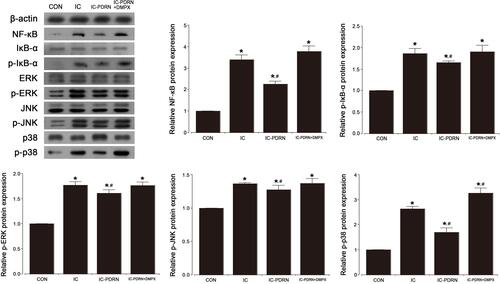
Figure 6 Cyclic adenosine-3ʹ,5ʹ-monophosphate (cAMP), cAMP response element-binding protein (CREB) and protein kinase A (PKA). (A) cAMP level in the bladder tissue. (B) Relative ratio of phosphorylated CREP (p-CREB) to CREB in bladder tissue. (C) Relative ratio of phosphorylated PKA (p-PKA) to PKA in bladder tissue. *Indicates P < 0.05 when compared with the control group. #Indicates P < 0.05 compared with the IC-induced group.
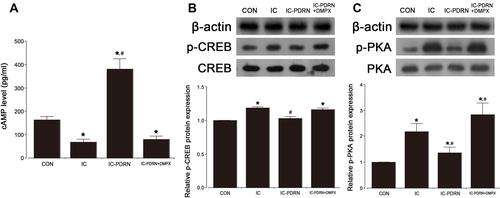
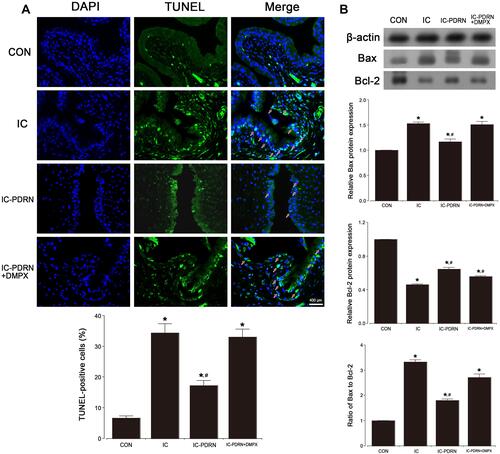
Figure 7 Apoptosis in the bladder tissue. (A) Percentages of terminal deoxynucleotidyl transferase-mediated dUTP nick end labeling (TUNEL)-positive (red arrows) cells in the bladder tissue. (B) Relative ratio of Bax to Bcl-2 in bladder tissue. *Indicates P < 0.05 compared with the control group. #Indicates P < 0.05 compared with the IC-induced group.