Figures & data
Table 1 Sequences of Primers Used for Real-Time Quantitative Polymerase Chain Reaction
Figure 1 DCs transduced with LV-Dectin-1-RNAi-GFP. (A) mDCs purified with CD11c microbeads. *(×400) (B) The expression of GFP in DCs 72 h after LV-Dectin-1-RNAi-GFP transduction observed in fluorescence microscopy. (×200) (C and D) Western blot analysis of Dectin-1 protein expression in DCs transduced with LV-Dectin-1-RNAi-GFP. n = 3. (E) qRT-PCR analysis of Dectin-1 mRNA expressions in DCs transduced with LV-Dectin-1-RNAi-GFP. GADPH served as an internal control. (F) Purity of CD11c+ DCs. Data represent the mean ± SD. **P < 0.01.
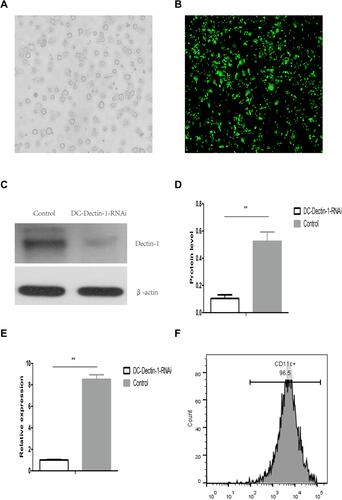
Figure 2 DC-Dectin-1-RNAi decreased the expression of MHC-II and costimulatory molecule. (A) DCs transduced with LV-Dectin-1-RNAi-GFP were stained with fluorescence conjugated MHC-II, CD40, CD80, CD83, and CD86 mAbs 24–48 h later. MHC-II and costimulatory molecules expression were reduced to different degrees compared to DC-GFP. (B) Effect of dendritic cells’ stimulation on proliferation of T lymphocytes in mixed lymphocytes reaction. (C) DC-Dectin-1-RNAi reduced the IL-17 and IFN-γ level, increased the IL-10 level of supernatants in mixed lymphocytes reaction. (D) DC-Dectin-1-RNAi exhibited stronger phagocytic ability than DC-GFP. *P < 0.05, **P < 0.01, ***P < 0.0001.
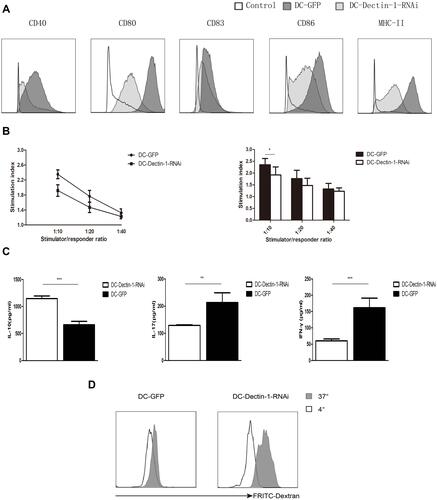
Figure 3 DCs transduced with LV-Dectin-1-RNAi-GFP prolonged the islet allografts survival. (A) Purified islets isolated from the perfusion, digestion, and purification procedure. The purity of islets was evaluated by DTZ staining and the activity was evaluated by AO-PI staining (×40). (B) Intraperitoneal glucose tolerance tests (IPGTTs) were performed on day 7 post-transplantation to test recipient glucose tolerance after 4–6 h of fasting. (C) IPGTTs were repeated after the removal of islet-bearing kidney to confirm recipient blood glucose response was islet allograft dependent. (The upper limit of the blood glucose meter is 33.3 mmol/L, and if the blood glucose level was above the limit it was recorded as 33.3 mmol/L. Data are expressed as mean only.). (D) Survival curve of islet grafts. Graft survival between groups of PBS control, DC-GFP, and DC-Dectin-1-RNAi was compared with Kaplan–Meier analysis (n = 5 animals/group). (E) On day 7 and rejection after transplantation, kidneys were removed and stained with the indicated markers. DC-Dectin-1-RNAi treated recipients displayed higher expression of insulin and glucagon compared to the other groups, indicating greater function and survival of islet grafts (× 200).
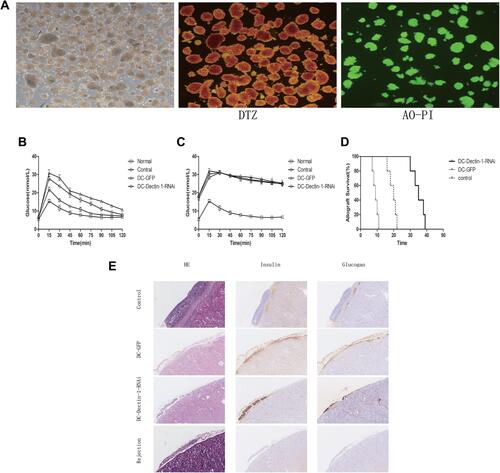
Figure 4 DC-Dectin-1-RNAi reduced the population of Th1 and Th17 cells, increased the frequency of Treg cells (A and B). The percentage of Th1, Th17, and Treg in draining lymph nodes and spleens were analyzed after transplantation (A only shows day 7 in spleens). Data represent the mean ± SD. *P < 0.05, **P < 0.01, ***P < 0.0001, n = 5 animals/group.
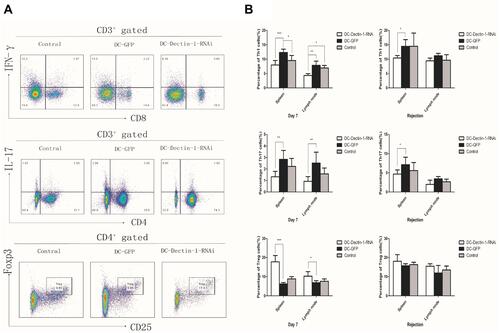
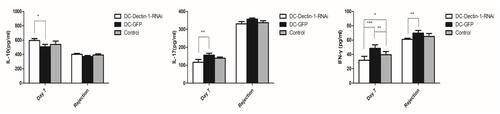
Figure 5 Cytokines level of serum were analyzed on day 7 after transplantation and on the day of rejection, DC-Dectin-1-RNAi reduced the IL-17 and IFN-γ level of serum, increased the IL-10 level of serum. Data represent the mean ± SD. *P < 0.05, **P < 0.01, ***P < 0.0001, n = 5 animals/group.