Figures & data
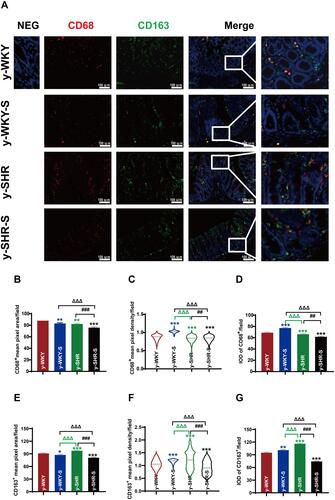
Figure 1 Chart showing the changes in MAP, weight and its correlation under restraint stress. (A) Experimental design flow chart: (a) schematic diagram of structural device for measuring blood pressure in caudal vein. (b) Test design and flow chart of test content. (c) Experimental grouping and experimental stress flow pattern diagram. (B) Alone with y-WKY-S rats, y-SHR-S received restraint stress at 3 h per day lasting 7 days were subject to MAP measurement every hour. (C) Representative body weight changes recording at indicated time points are shown. (D) Co-relationship between the MAP and body weight. Data were expressed as mean ± SEM. (n = 6–8 per group). *p < 0.05, **p < 0.01, ***p < 0.001 (Black y-SHR-S vs y-WKY, Blue y-WKY-S vs y-WKY, Green y-SHR vs y-WKY); #p < 0.05, ##p < 0.01 (y-SHR-S vs y-SHR); Δp < 0.05, ΔΔp < 0.01 (y-SHR-S vs y-WKY-S).
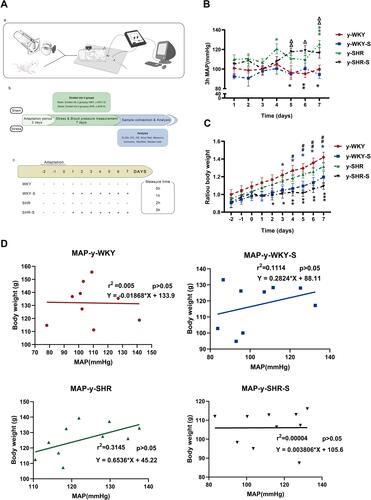
Figure 2 Stress-related changes in hormone levels in the plasm. (A–D) The concentrations of ACTH, CORT, NE and Ang II was notable enhancement in the stress-condition than its control group, respectively. *p < 0.05, **p < 0.01, ***p < 0.001 (Black y-SHR-S vs y-WKY, Blue y-WKY-S vs y-WKY, Green y-SHR vs y-WKY); #p < 0.05 (y-SHR-S vs y-SHR); Δp < 0.05, ΔΔp < 0.01, ΔΔΔp < 0.001 (Black y-SHR-S vs y-WKY-S, Green y-SHR vs y-WKY-S).
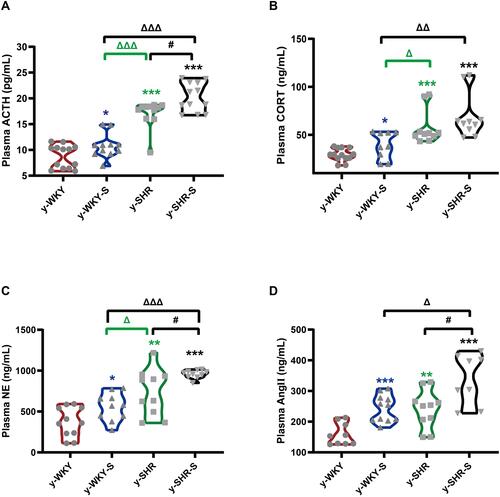
Figure 3 Stress-related changes in cytokine levels in plasma and its correlation with the hormone in different group. (A–F) Comparison of plasma cytokine levels in y-WKY, y-WKY-S, y-SHR and y-SHR-S. All data was shown as means ± SEM for each cytokine. Unpaired t-test. (G) Correlograms of the correlations among 10 plasma hormone and cytokine concentrations for (G1) y-WKY, (G2) y-WKY-S, (G3) y-SHR and (G4) y-SHR-S using Pearson correlation coefficients. A blue and red color represent a positive and negative correlation between the two plasma cytokine concentrations that meet at that cell, respectively. The darker and more saturated the color, the greater the magnitude of the correlation. *p < 0.05, **p < 0.01, ***p < 0.001 (Black y-SHR-S vs y-WKY, Blue y-WKY-S vs y-WKY, Green y-SHR vs y-WKY); #p < 0.05, ###p < 0.001 (y-SHR-S vs y-SHR); Δp < 0.05, ΔΔp < 0.01, ΔΔΔp < 0.001 (Black y-SHR-S vs y-WKY-S, Green y-SHR vs y-WKY-S).
Figure 4 Alteration of histopathological structure in the colon of younger restraint stress hypertensive rats from the y-WKY and y-SHR groups. (A1 and A2) Colon was measured the length with a ruler to quantify the effect of restraint stress in different groups. (B–D) Cross-sections of the distal colon were observed at 200× magnification using a light microscope. The length of the mucosa layer and muscle thickness in each tissue were measured using Leica Application Suite. (B and F) were stained with hematoxylin-eosin (HE) to measure the thickness of mucosa layer (Max: double arrows; Min: single arrows), Obtain B’ by zooming in part of B (black frame). (B’and E) The number of goblet cells (arrow) in each intact crypt was decreased in different groups. (C and G) The thickness of submucosa layer (Max: double arrows; Min: single arrows). (D and H) The thickness of muscularis propria layer (All: dotted double arrows; Inner: double arrows; Outer single arrows). Data are mean ± SEM. Unpaired t-test (n = 5–8 per group, choose 8 fields per rat) Scale bar: 50 μm. *p < 0.05, **p < 0.01, ***p < 0.001 (Black y-SHR-S vs y-WKY, Blue y-WKY-S vs y-WKY, Green y-SHR vs y-WKY); #p < 0.05, ###p < 0.001 (y-SHR-S vs y-SHR); Δp < 0.05, ΔΔp < 0.01, ΔΔΔp < 0.001 (Black y-SHR-S vs y-WKY-S, Green y-SHR vs y-WKY-S).
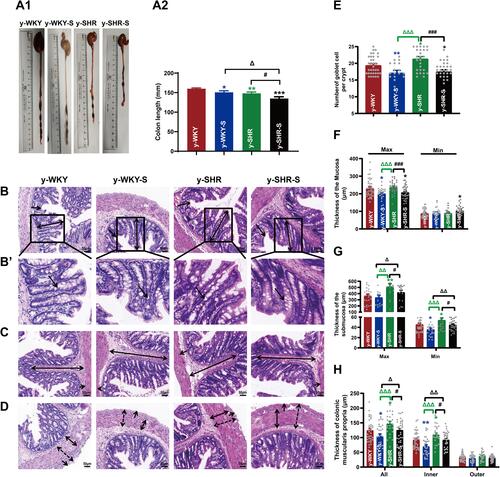
Figure 5 Histological evaluation and TEM images of tissues collected from rats in the y-WKY and y-SHR groups alone and their subgroups of y-WKY-S and y-SHR-S. Restraint stress treatment unaltered the fibrosis (white arrow) in the distal colon of the SHRs. (A) Masson’s trichrome staining was performed to evaluate the fibrotic changes in the distal colon of different groups. (B) Sirius Red staining was performed to evaluate the fibrotic changes in the distal colon of different groups with the optical microscope. (C and C’) Observation of Sirius Red staining with polarized light microscope, magnify the part of C to get C’ for further observation of details (black frame). (D and D’) Collagen fiber ultrastructure of a colonic tissues in the four groups, magnify the part of D to get D’ for further observation of details (black frame). (E and F) Scatter plots show the percentage of positive pixel area of collagen in the colon sections from different groups was quantified by the software (IPP). Scale bar: 50 μm. Data were expressed as mean ± SEM, Unpaired t-test (n = 5 per group; choose 5 fields per rat). *p < 0.05, **p < 0.01 (Black y-SHR-S vs y-WKY, Blue y-WKY-S vs y-WKY, Green y-SHR vs y-WKY); #p < 0.05, ##p < 0.01 (y-SHR-S vs y-SHR); Δp < 0.05, ΔΔΔp < 0.001 (Black y-SHR-S vs y-WKY-S, Green y-SHR vs y-WKY-S).
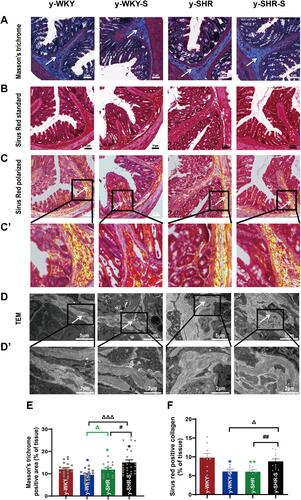
Figure 6 Effect of a restrain stress on the barrier function in the colon. (A) Time-dependent changes in FITC-dextran 4000 (FD-4) flux through all subgroups as paracellular pathway for 120 mins. (B) Horseradish peroxidase (HRP) flux (=transcellular pathway) was measured ex vivo. (C) Western blot for TJ proteins. Distal colon was subjected to immunoblotting for ZO-1, occludin, claudin-5 and GAPDH. Representative results of one experiment are shown. Similar results were obtained in three independent experiments: y-WKY group, y-WKY-S group, y-SHR group, y-SHR-S group. (D–F) The intensity of the bands was quantified by scanning densitometry, standardized with respect to ZO-1, occludin, claudin-5 and GAPDH protein and expressed as mean ± SEM. Unpaired t-test, *p < 0.05, ***p < 0.001 (Blue y-WKY-S vs y-WKY, Green y-SHR vs y-WKY); #p < 0.05, ##p < 0.01 (y-SHR-S vs y-SHR); Δp < 0.05, ΔΔp < 0.01 (Black y-SHR-S vs y-WKY-S, Green y-SHR vs y-WKY-S).
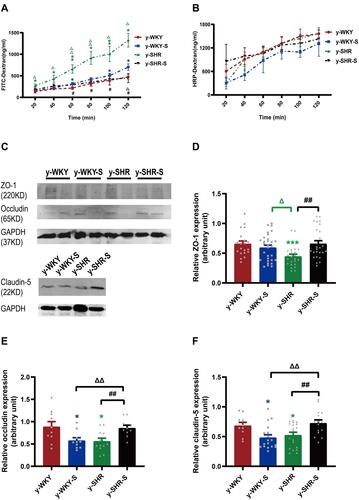
Figure 7 Fecal bacterial diversity in colon. Gut microbiota communities in difference groups fecal samples were collected from colon of y-WKY (n=4), y-WKY-S (n=5), y-SHR (n=5) and y-SHR-S (n=5) rats and bacterial 16S rDNA were amplified and sequenced to analyze the compositions of microbial communities. (A–C) Fecal biomass and microbial richness and diversity of different groups were evaluated. (D)The Firmicutes to Bacteroidetes ratio (F/B ratio) was observed between the four clusters. (E) Principal coordinate analysis of different groups. Weighted uniFrac analyses were used to calculate the distances between fecal samples among different groups. Each axis percentage describes how much variation that 1-dimension accounts for. By comparing the samples in a 3-dimensional figure, a clear separation was observed between the four clusters. (F) Phylum breakdown of the five most abundant bacterial communities in the difference groups fecal samples. An increase of Firmicutes along with a decrease of Bacteroidetes resulted in a dysbiosis signature of colon microbiota in y-SHR rats. A significant increment changes of the Actinobacteria phylum correlated with a higher diversity value. (G and H) Differences of the top 30 bacteria between different groups at the level of family and genes, red means increase, green means decrease, blue means no difference. Results were compared by Unpaired t-test; *p < 0.05, **p < 0.01 (Black y-SHR-S vs y-WKY, Green y-SHR vs y-WKY); ##p < 0.01 (y-SHR-S vs y-SHR); Δp < 0.05, ΔΔp < 0.01 (Black y-SHR-S vs y-WKY-S, Green y-SHR vs y-WKY-S).
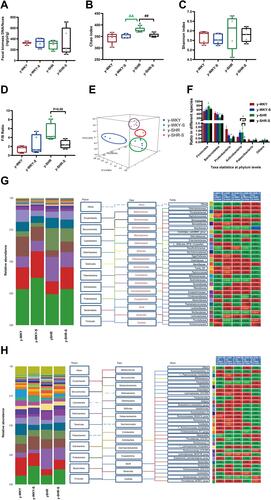
Figure 8 Fecal bacterial diversity in ileocecum. Gut microbiota communities in difference groups fecal samples were collected from ileocecum of y-ic-WKY (n=4), y-ic-WKY-S (n=4), y-ic-SHR (n=5) and y-ic-SHR-S (n=5) rats and bacterial 16S rDNA were amplified and sequenced to analyze the compositions of microbial communities. (A–C) Fecal biomass and microbial richness and diversity of different groups were evaluated.(D)The Firmicutes to Bacteroidetes ratio (F/B ratio) was observed between the four clusters. (E) Principal coordinate analysis of different groups. Weighted uniFrac analyses were used to calculate the distances between fecal samples among different groups. Each axis percentage describes how much variation that 1-dimension accounts for. By comparing the samples in a 3-dimensional figure, a clear separation was observed between the four clusters. (F) Phylum breakdown of the five most abundant bacterial communities in the difference groups fecal samples. (G and H) Differences of the top 30 bacteria between different groups at the level of family and genes, Red means increase, green means decrease, blue means no difference. Results were compared by Unpaired t-test; *p < 0.05, **p < 0.01, ***p<0.001 (Black y-ic-SHR-S vs y-ic-WKY, Blue y-ic-WKY-S vs y-ic-WKY, Green y-ic-SHR vs y-ic-WKY); Δp < 0.05 (y-ic-SHR vs y-ic-WKY-S).
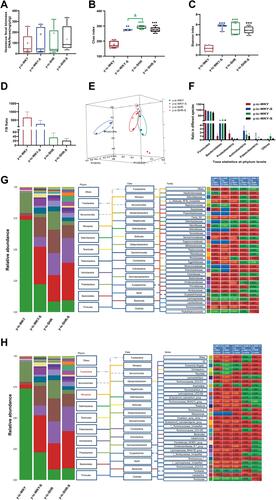
Figure 9 Relative abundance of different diversity in different groups from ileocecum (phylogenetic diversity index). (A–D) shown the genus significant differences at the genus level in the different groups (MetaStat). (E) Phylogenetic tree of the linear discriminant analysis (LDA) scores for differentially abundant genera. y-ic-WKY (blue), y-ic-WKY-S (purple), y-ic-SHR (red) and y-ic-SHR-S (green) (LefSe). (F) The relative proportion of Bifidobacterium between different groups. (G) The relative proportions of lactate-producing bacteria in the gut microbiota in difference groups. Sequence reads were classified according to the primary end product of the assigned bacterial genera. Genera were classified into more than one group correspondingly if they were defined as producers of multiple metabolites. Results were compared by Unpaired t-test; **p < 0.01, ***p<0.001 (Blue y-ic-WKY-S vs y-ic-WKY, Green y-ic-SHR vs y-ic-WKY); #p < 0.05, ##p < 0.01 (y-ic-SHR-S vs y-ic-SHR); Δp < 0.05, ΔΔp < 0.01 (Black y-ic-SHR-S vs y-ic-WKY-S, Green y-ic-SHR vs y-ic-WKY-S).
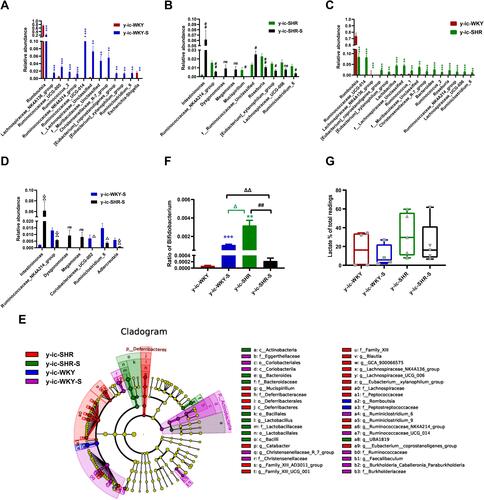
Figure 10 Relative abundance of different diversity between different groups in colon (phylogenetic diversity index). (A–D) The genera with significant differences at the genus level in the different groups (MetaStat). (E) Phylogenetic tree of the linear discriminant analysis (LDA) scores for differentially abundant genera. y-WKY (blue), y-WKY-S (purple), y-SHR (red) and y-SHR-S (green) (LefSe). (F) The relative proportion of Bifidobacterium between different groups. (G) The relative proportions of lactate-producing bacteria in the gut microbiota in difference groups. Sequence reads were classified according to the primary end product of the assigned bacterial genera. Genera were classified into more than one group correspondingly if they were defined as producers of multiple metabolites. Results were compared by Unpaired t-test; *p < 0.05, **p < 0.01, ***p < 0.001 (Black y-SHR-S vs y-WKY, Blue y-WKY-S vs y-WKY, Green y-SHR vs y-WKY); #p < 0.05, ##p < 0.01, ###p < 0.001 (y-SHR-S vs y-SHR); Δp < 0.05, ΔΔp < 0.01, ΔΔΔp < 0.001 (Black y-SHR-S vs y-WKY-S, Green y-SHR vs y-WKY-S).
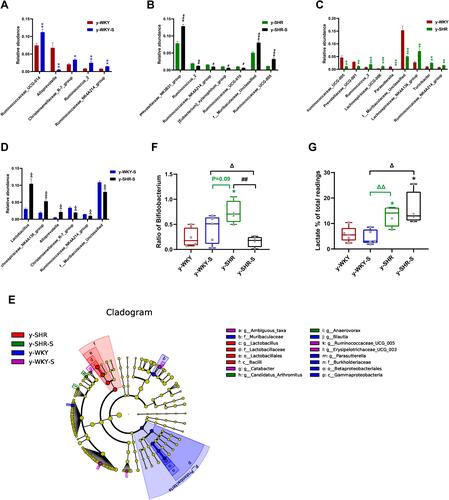
Figure 11 Accumulation of macrophages in colon tissues of stressed rat. (A) Immunofluorescence staining for the accumulation of M1Mφ and M2Mφ in colon tissue after 1 week of restraint pressure. The white box is a further enlargement of the partial picture, bar =100 µm. (B–G) Quantitative analysis of M1 and M2-positive cells relative to total nuclear number (IOD=area × density). Data are expressed as mean ± SEM. n = 5 rats expressing the number rats in each group. *p < 0.05, **p < 0.01, ***p < 0.001 (Black y-SHR-S vs y-WKY, Blue y-WKY-S vs y-WKY, Green y-SHR vs y-WKY); ##p < 0.01, ###p < 0.001 (y-SHR-S vs y-SHR); ΔΔΔp < 0.001 (Black y-SHR-S vs y-WKY-S, Green y-SHR vs y-WKY-S).