Figures & data
Table 1 Effect of Etanercept Concentration on Human Islet Characterisation After 3–4 Days of Culture in Normoxia (n = 8)
Figure 1 Effect of Etanercept concentration on human islet (A) yield (%) normalised to preculture, (B) size index (IEQ/IN), and (C) overall survival (%). Islet characterisation was performed after 3–4 days of culture in normoxic atmosphere. *P < 0.05, **P < 0.01, ***P < 0.001 vs 0 µg/mL as indicated.
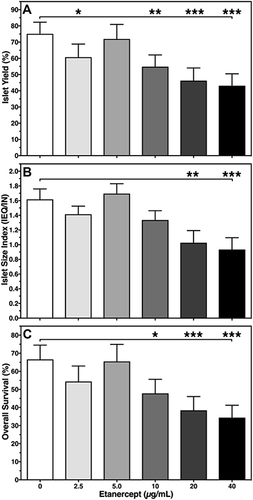
Figure 2 Sequential glucose-stimulated insulin release after 3–4 days of human islet culture in (A) normoxic (n = 7) or (B) hypoxic atmosphere (n = 8). Insulin release of 20 IEQ is expressed as percentage of intracellularly stored insulin (striped bars). Symbols inside bars indicate *P < 0.05, **P < 0.01 for 2.0 vs 20 mmol/L of glucose. (A) †P < 0.05 for basal release at 40 µg/mL vs 0 µg/mL; **P < 0.01, ***P < 0.001 for intracellular insulin at 20 and 40 µg/mL vs 0 µg/mL. (B) *P < 0.05 for basal release at 5 µg/mL vs 0 µg/mL.
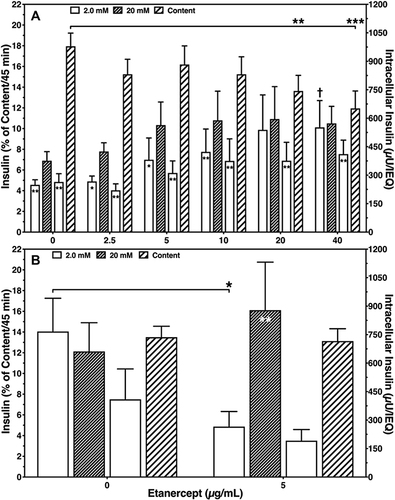
Table 2 Effect of Etanercept on Islet Characterisation After 3–4 Days of Culture in Hypoxic Atmosphere (n = 11)
Table 3 Effect of Etanercept on Islet Chemokine Production During 3–4 Days of Culture in Hypoxic Atmosphere (n = 6)
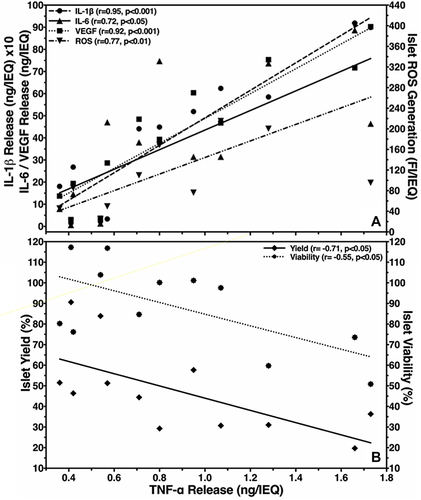
Figure 3 Effect of TNF-α production in hypoxic islets on (A) release of IL-1β (●), IL-6 (▲), VEGF-A (■)(left y-axis) and ROS generation (▼)(right y-axis) or (B) postculture islet yield (◆)(left y-axis) and viability (□)(right y-axis). The correlation coefficient (r) was calculated using Spearman’s rank correlation.