Figures & data
Figure 1 A schematic diagram of m6A-seq and RNA-seq analyses of MH7A cells. MH7A cells were stimulated with TNF-α, and total RNA was extracted from MH7A cells. Then, the RNA was fragmented, and m6A RNA was isolated as described by the m6A-RNA immunoprecipitation (Me-RIP) assay. The m6A-seq library and RNA-seq library of these mRNAs were constructed, and then sequenced for analysis.
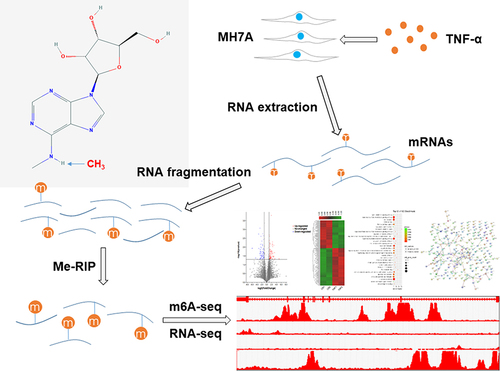
Figure 2 Transcriptome-wide m6A-Seq revealed global m6A modification patterns in MH7A cells after stimulation with TNF-α. (A) Venn diagram of m6A modified genes in the control group and the TNF-α group. (B) The distribution patterns of m6A peaks in different chromosomes. (C) The number of m6A peaks in per chromosome. (D) The number of m6A peaks in each group. (E), Violin plot of the relative abundance of m6A peaks in each group.
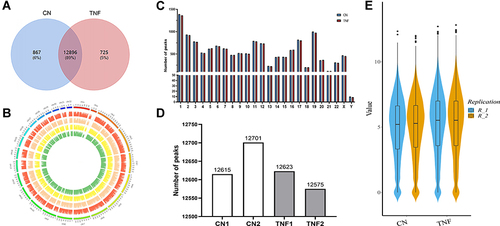
Figure 3 Genes with differential m6A methylation modification genes in MH7A cells after stimulation with TNF-α. (A) Volcano plot representation of microarray data on the differentially expressed m6A methylation genes between the control group and TNF-α group. The blue and red dots to the left and to the right of the two vertical lines indicate more than a 1.5 fold change and represent the differentially expressed m6A methylation genes with statistical significance. Statistical significance was defined as a fold change of 1.5 and a p-value of 0.05 between the control and TNF-α groups. (B) Hierarchical cluster analysis of differentially expressed m6A methylation genes between the control group and TNF-α group. Hierarchical clustering showed that the differentially expressed m6A methylation genes ultimately clustered into two major branches, including hypermethylated genes, which are labeled in red, and hypomethylated genes, which are labeled in green. The darker the color, the more significant the difference. (C) The sector graph shows the proportion of m6A methylation distribution in the indicated regions. (D) The number of genes with differential m6A methylation in per chromosome. (E) PPI of differentially expressed m6A methylation genes. (F) The top 30 enriched GO terms of differentially expressed m6A methylated genes in MH7A cells. (G) The top 30 pathway enrichments of differentially expressed m6A methylated genes in MH7A cells.
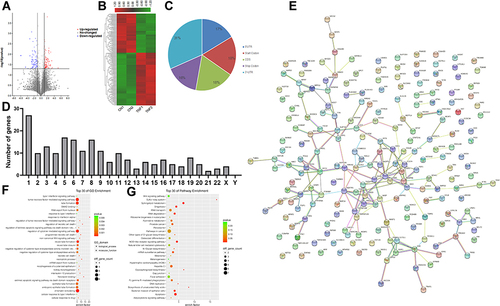
Table 1 List of the Top 10 Hypermethylated Genes and the Top 10 Hypomethylated Genes
Figure 4 Differences in the mRNA expression genes in MH7A cells after stimulation with TNF-α. (A) Volcano plot representation of microarray data on the differentially expressed mRNA genes between the control group and TNF-α group. The blue and red dots to the left and to the right of the two vertical lines indicate more than a 1.5-fold change and represent the differentially expressed genes with statistical significance. Statistical significance was defined as a fold change of 1.5 and a p-value of 0.05 between the control and TNF-α groups. (B) Hierarchical cluster analysis of differentially expressed mRNA genes between the control group and TNF-α group. Hierarchical clustering showed that the differentially expressed genes ultimately clustered into two major branches, including upregulated genes, which are labeled in red, and downregulated genes, which are labeled in green. The darker the color, the more significant the difference. (C) PPI of differentially expressed mRNA genes. (D) The top 30 enriched GO terms of differentially expressed mRNA genes in MH7A cells. (E) The top 30 pathway enrichments of differentially expressed mRNA genes in MH7A cells.
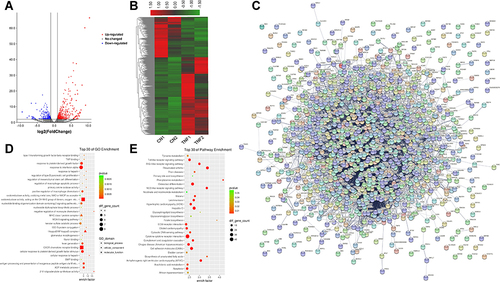
Table 2 List of the Top 10 Up-Regulated mRNAs and the Top 10 Down-Regulated mRNAs
Figure 5 Joint analysis of m6A methylation and mRNA expression in MH7A cells after stimulation with TNF-α. (A) Four quadrant graph of genes with differential m6A methylation and differentially expressed mRNA levels. (B) Venn diagram of genes with differential m6A methylation and differentially expressed mRNA levels. (C) PPI of genes with differentially expressed m6A methylation and differential expressed mRNA. (D) The top 30 GO enrichments of genes with differentially expressed m6A methylation and differentially expressed mRNA in MH7A cells. (E) The top 30 pathway enrichments of genes with differentially expressed m6A methylation and differentially expressed mRNA in MH7A cells.
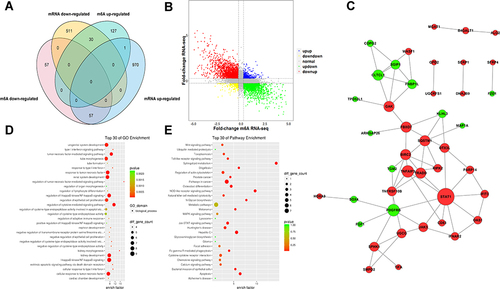
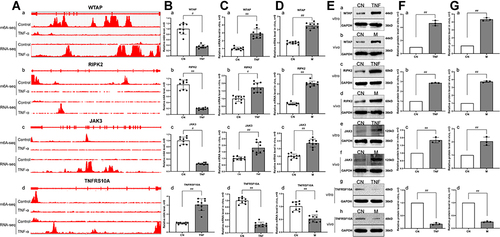
Figure 6 Correlation analysis, RT-qPCR and Western blot verification of genes with differential m6A modification and differential mRNA expression. (A) Integrative genomics viewer (IGV) plots of m6A methylation abundances and expression abundances in the control group and the TNF-α group. The x-axis represents the genomic position and the y-axis represents the sequence read number. a, the m6A methylation abundances and expression abundances of WTAP. b, the m6A methylation abundances and expression abundances of RIPK2. c, the m6A methylation abundances and expression abundances of JAK3. d, the m6A methylation abundances and expression abundances of TNFRSF10A. (B) The m6A methylation levels were measured by RT-qPCR in the control group and the TNF-α group. a, the m6A methylation level of WTAP. b, the m6A methylation level of RIPK2. c, the m6A methylation level of JAK3. d, the m6A methylation level of TNFRSF10A. (C) The mRNA expression levels in MH7A cells were measured by RT-qPCR. a, the mRNA expression level of WTAP. b, the mRNA expression level of RIPK2. c, the mRNA expression level of JAK3. d, the mRNA expression level of TNFRSF10A. #p < 0.05, ##p < 0.01 compared with the control group. (D) The mRNA expression levels were measured by RT-qPCR in synovial tissues of AA rats. a, the mRNA expression level of WTAP. b, the mRNA expression level of RIPK2. c, the mRNA expression level of JAK3. d, the mRNA expression level of TNFRSF10A. #p < 0.05, ##p < 0.01 compared with the control group. (E) The protein expression levels were measured by Western blot in MH7A cells and synovial tissues of AA rats. a, the protein expression level of WTAP in MH7A cells. b, the protein expression level of WTAP in synovial tissues of AA rats. c, the protein expression level of RIPK2 in MH7A cells. d, the protein expression level of RIPK2 in synovial tissues of AA rats. e, the protein expression level of JAK3 in MH7A cells. f, the protein expression level of JAK3 in synovial tissues of AA rats. g, the protein expression level of TNFRSF10A in MH7A cells. h, the protein expression level of TNFRSF10A in synovial tissues of AA rats. (F), Semiquantitative analysis of protein expression in MH7A cells. a, semiquantitative analysis of WTAP protein. b, semiquantitative analysis of RIPK2 protein. c, semiquantitative analysis of JAK3 protein. d, semiquantitative analysis of TNFRSF10A protein. #p < 0.05, ##p < 0.01 compared with the control group. (G) Semiquantitative analysis of protein expression in synovial tissues of AA rats. a, semiquantitative analysis of WTAP protein. b, semiquantitative analysis of RIPK2 protein. c, semiquantitative analysis of JAK3 protein. d, semiquantitative analysis of TNFRSF10A protein. #p < 0.05, ##p < 0.01 compared with the control group.