Figures & data
Table 1 Comparison of Baseline Characteristics Between the Training and Validation Datasets
Figure 1 The four independent risk factors in the final model were illustrated in a forest plot and selected for developing the scoring system, including nutritional risk index, C-reactive protein, alkaline phosphatase, and lactate dehydrogenase. The assignment of points to each variable was based on the corresponding β regression coefficient. Each variable’s coefficient was divided by 0.580 (the lowest β value, corresponding to lactate dehydrogenase) and rounded to the nearest integer.
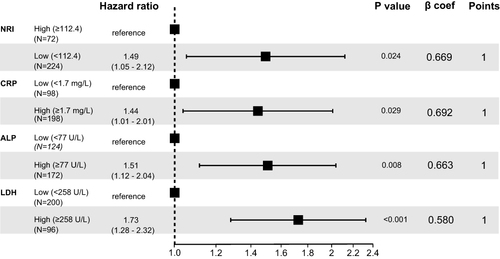
Figure 2 The distribution of chemotherapy responses (A) and disease control (B) for each prognostic nutrition and inflammation index (PNII) category in the training cohort. The PNII score’s performance for predicting short-term disease control against other traditional baseline factors in the training cohort (C). The distribution of chemotherapy responses (D) and disease control (E) for each prognostic nutrition and inflammation index (PNII) category in the validation cohort. The PNII score’s performance for predicting short-term disease control against other traditional baseline factors in the validation cohort (F).
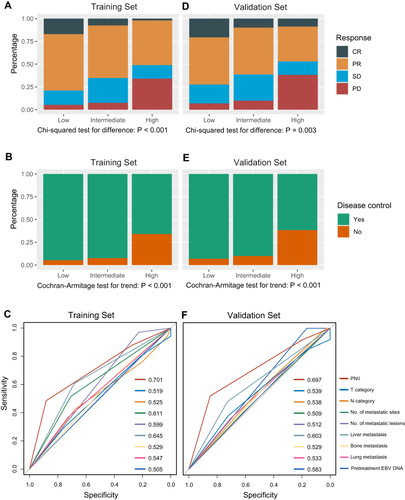
Figure 3 Survival curves for progression-free survival and overall survival stratified by prognostic nutrition and inflammation index (PNII) category in the training (A, B) and validation (C, D) cohorts.
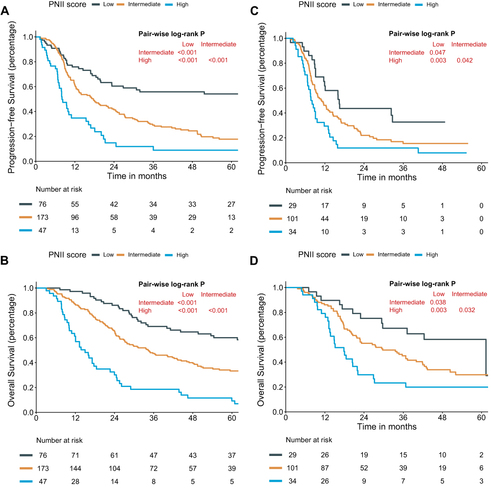
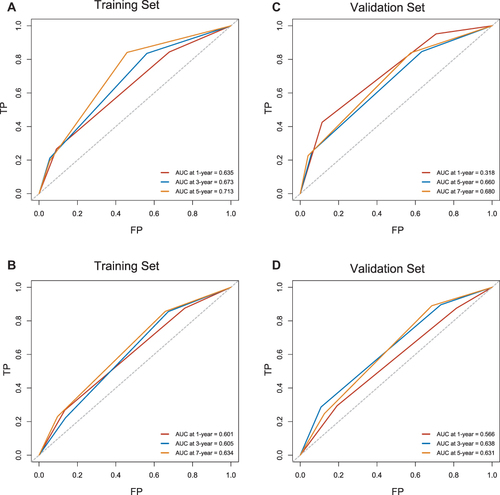
Figure 4 The predictive accuracy of the prognostic nutrition and inflammation index (PNII) score for progression-free survival and overall survival in the training (A, B) and validation (C, D) cohorts.