Figures & data
Table 1 Primers Used for qRT-PCR
Figure 1 Effects of KCa3.1 inhibition by TRAM-34 on LCWE-induced cytotoxicity and activation in RAW264.7 cells. (A) RAW264.7 cells were stimulated with LCWE (1 μg/mL) for 12 h. The protein level of KCa3.1 was detected by Western blot. Results are expressed as the mean ± SD. **p < 0.01 versus control group. (B, C) Cytotoxicity of RAW264.7 cells treated by TRAM-34 (0, 1, 5, 10, 15 μM) with or without LCWE (1 μg/mL) was determined by CCK8 assay. Results (n = 5) are expressed as the mean ± SD, * p < 0.05, **p < 0.01 versus untreated group, # p < 0.05 versus LCWE-treated group. (D) The representative microphotographs showed phenotypic changes of RAW 264.7 cells in responsive to different stimuli (LCWE (1 μg/mL), TRAM-34 (10 μM)) for 12 h. Magnification = 100× or 200×. Scale bar = 100 µm.
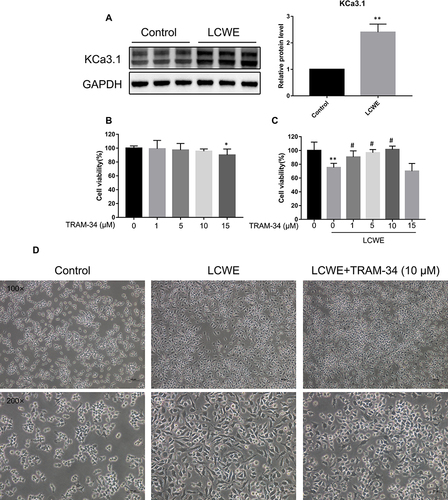
Figure 2 Blocking KCa3.1 with TRAM-34 inhibits LCWE-induced inflammatory response in RAW264.7 cells. RAW264.7 cells were pretreated with TRAM-34 (0, 1, 5, 10 μM) 30 min, then exposed to LCWE (1 μg/mL) for 12 h. The mRNA expressions of IL-1β (A), IL-6 (B), TNF-α (C), MCP-1 (D), iNOS (E) and MMP-9 (F) were assayed by qRT-PCR, respectively. The protein levels of iNOS (G) as well as MMP-9 (I) were detected using Western blot. (H) Culture supernatants of RAW264.7 cells were collected for NO detection by Griess reagent. All results are expressed as the mean ± SD. ***p < 0.001, ****p < 0.0001 versus untreated group; # p < 0.05, ##p < 0.01, ###p < 0.001, ####p < 0.0001 versus LCWE group.
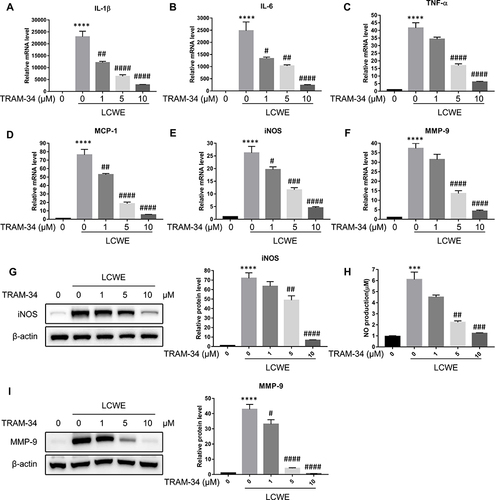
Figure 3 KCa3.1 inhibition by TRAM-34 suppresses inflammatory reaction in LCWE-stimulated mouse peritoneal macrophages. Mouse peritoneal macrophages were pretreated with TRAM-34 (10 μM) 30 min, then stimulated with LCWE (1 μg/mL) for 12 h. The expressions of IL-1β (A), IL-6 (B), TNF-α (C), MCP-1 (D), iNOS (E) and MMP-9 (F) at the mRNA levels were measured using qRT-PCR, respectively. Effects of TRAM-34 pretreatment on the protein expressions of iNOS (G) and MMP-9 (H) were analyzed by Western blot. All results are expressed as the mean ± SD. **p < 0.01, ***p < 0.001, ****p < 0.0001 versus control group; #p < 0.05, ##p < 0.01, ###p < 0.001 versus LCWE group.
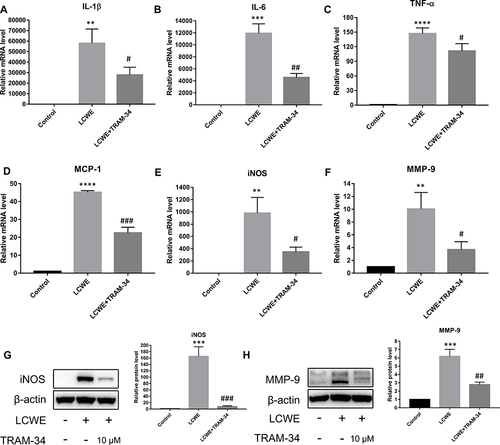
Figure 4 KCa3.1 blockade by TRAM-34 inhibits the activation of NF-κB and STAT3 caused by LCWE stimulation in RAW264.7 cells. RAW264.7 cells were stimulated with LCWE (1 μg/mL) for 12 h after 30 min pretreatment of TRAM-34 (0, 1, 5, 10 μM). (A) The nuclear or cytoplasmic protein levels of NF-κB p65 were detected by Western blot. (B) The expressions of p-STAT3 and STAT3 were examined via Western blot. (C) The protein levels of p-p38 and p38 were assayed by Western blot. All results are expressed as the mean ± SD. *p < 0.01, **p < 0.01, ***p < 0.001, ****p < 0.0001 versus untreated group; #p < 0.05, ##p < 0.01, ###p < 0.001 versus LCWE group.
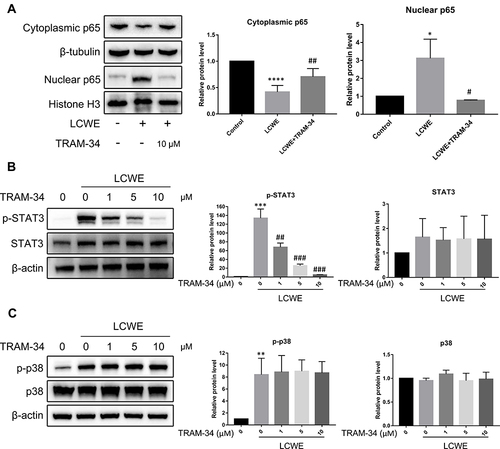
Figure 5 NF-κB signal pathway is necessary for LCWE-induced inflammatory reaction in RAW264.7 cells. RAW264.7 cells were pretreated with PDTC (0, 100, 200, 500, 1000 μM) 30 min before stimulation with LCWE (1 μg/mL) for 12 h. qRT-PCR was performed to test the mRNA expressions of IL-1β (A), IL-6 (B), TNF-α (C), MCP-1 (D), iNOS (E) and MMP-9 (F) in RAW264.7 cells, respectively. The protein expressions of iNOS (G), MMP-9 (I) and NF-κB p65 at cytoplasm or nucleus (J) were analyzed by Western blot, respectively. (H) NO production was detected by Griess reagent. All results are expressed as the mean ± SD. **p < 0.01, ***p < 0.001, ****p < 0.0001 versus untreated group; #p < 0.05, ##p < 0.01, ###p < 0.001, ####p < 0.0001 versus LCWE group.
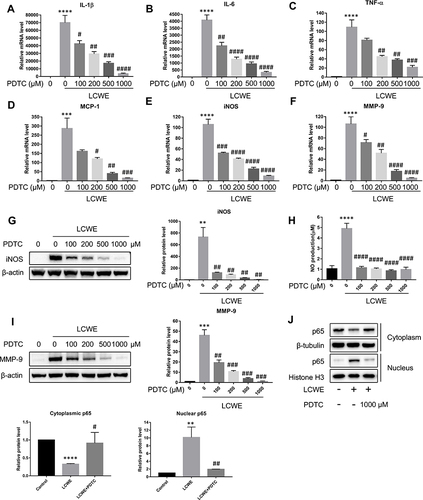
Figure 6 STAT3 signal pathway is involved in LCWE-induced inflammatory response in RAW264.7 cells. RAW264.7 cells were pretreated with AG490 (0, 1, 5, 10 μM) 30 min prior to the stimulation with LCWE (1 μg/mL) for 12 h. qRT-PCR was conducted to analyze the relative mRNA levels of IL-1β (A), IL-6 (B), TNF-α (C), MCP-1 (D), iNOS (E) and MMP-9 (F) in RAW264.7 cells, respectively. The relative protein levels of iNOS (G), MMP-9 (I), p-STAT3 and STAT3 (J) were examined by Western blot, respectively. (H) NO production was detected by Griess reagent. All results are expressed as the mean ± SD. ***p < 0.001, ****p < 0.0001 versus untreated group; #p < 0.05, ##p < 0.01, ###p < 0.001, ####p < 0.0001 versus LCWE group.
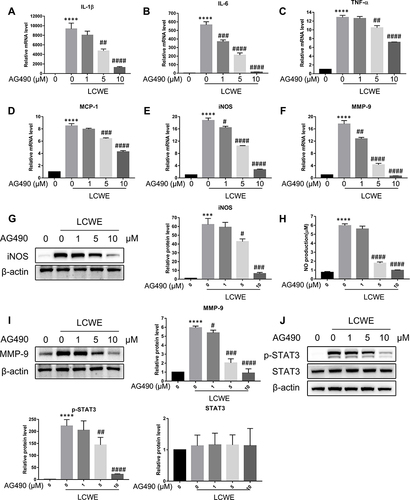
Figure 7 KCa3.1 inhibition of macrophages alleviates MCAECs inflammation induced by LCWE-treated RAW-CM. MCAECs were incubated with RAW264.7 cells-conditioned medium from various groups (Control, LCWE, LCWE+TRAM-34, LCWE+PDTC, LCWE+AG490) for 12 h. Expressions of IL-1β (A), TNF-α (B), MCP-1 (C) at the mRNA levels was examined by qRT-PCR. All results are expressed as the mean ± SD. ***p < 0.001, ****p < 0.0001 versus control group; #p < 0.05, ##p < 0.01, ###p < 0.001, ####p < 0.0001 versus LCWE group.
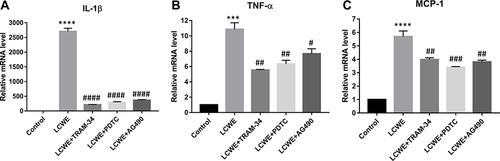
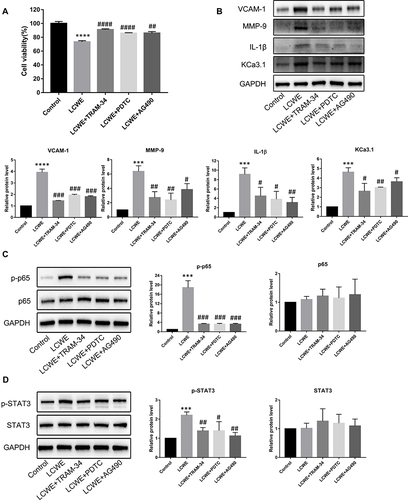
Figure 8 KCa3.1 inhibition of macrophages attenuates MCAECs injury mediated by LCWE-treated RAW-CM. MCAECs were incubated with RAW264.7 cells-conditioned medium from various groups (Control, LCWE, LCWE+TRAM-34, LCWE+PDTC, LCWE+AG490) 12 h for the detection of cell viability, MCAECs injury-related protein and STAT3 phosphorylation, or 1 h for the detection of phosphorylation of NF-κB p65. (A) Cell survival of MCAECs was determined by using CCK8 assay (n=5). (B) Expressions of VCAM-1, MMP-9, IL-1β and KCa3.1 were analyzed by Western blot. (C) Expressions of p-p65 and p65 at protein levels were measured by Western blot. (D) The protein levels of p-STAT3 and STAT3 were detected by Western blot. All results are expressed as the mean ± SD. ***p < 0.001, ****p < 0.0001 versus control group; #p < 0.05, ##p < 0.01, ###p < 0.001, ####p < 0.0001 versus LCWE group.