Figures & data
Table 1 Estimated Free Energy of Binding and Inhibition Constant of Major Plant Constituents for Potential Molecular Targets of Diabetes and Inflammation
Table 2 Effect of CA in the Glycemic Control on Diabetic Rats at Different Time Intervals. Data are Expressed as Means ± S.E.M; a= STZ vs Control (P˂0.0001); b= STZ vs STZ+GLI (P˂0.0001); c= STZ vs STZ+CA250 (P˂0.0001); d= STZ vs STZ+CA500 (P˂0.0001) (n=6)
Figure 1 Therapeutic potential of CA on HbA1c management in the diabetic rats. We used glibenclamide as a standard drug to compare the results. Data are expressed as means ± S.E.M.; ****p ≤ 0.00001 vs control or STZ-induced diabetic rats (n=6).
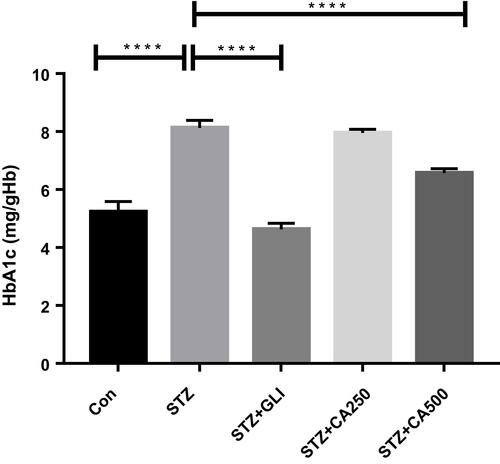
Figure 2 Effect of CA on body weight in the diabetic rats. We used glibenclamide as a standard drug to compare the results. Data are expressed as means ± S.E.M.; ****p ≤ 0.00001 vs control or STZ-induced diabetic rats (n=6).
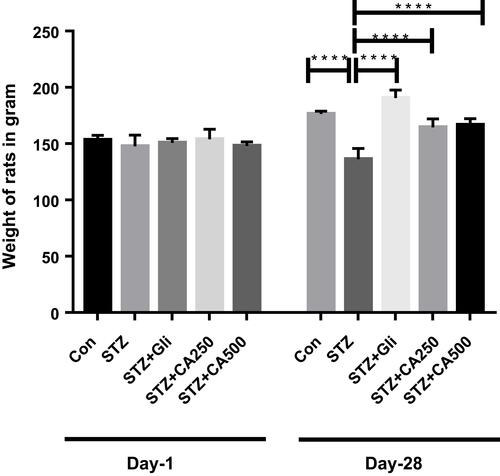
Figure 3 Effects of CA on lipid profile (A) triglyceride, (B) total cholesterol, (C) HDL, and (D) LDL in the diabetic rodents. Therapeutic efficacy of CA is compared with the antidiabetic drug glibenclamide. Data are expressed as means ± S.E.M.; ****p ≤ 0.00001 vs control or STZ; **p ≤ 0.001 vs STZ-induced diabetic rats (n=6).
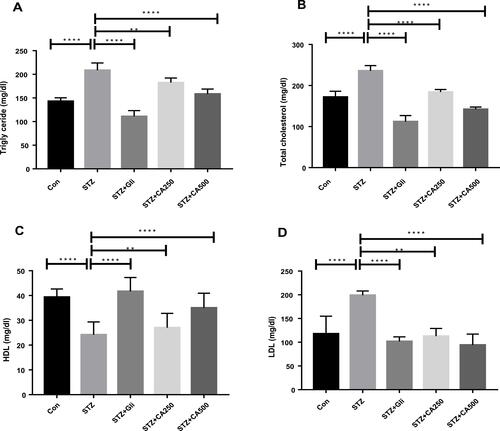
Figure 4 Efficacy of CA on liver functions (A) ALT, (B) AST, and (C) glycogen in the STZ-induced diabetic rats. Data are expressed as means ± S.E.M.; ****p ≤ 0.00001 vs control or STZ-induced diabetic rats (n=6).
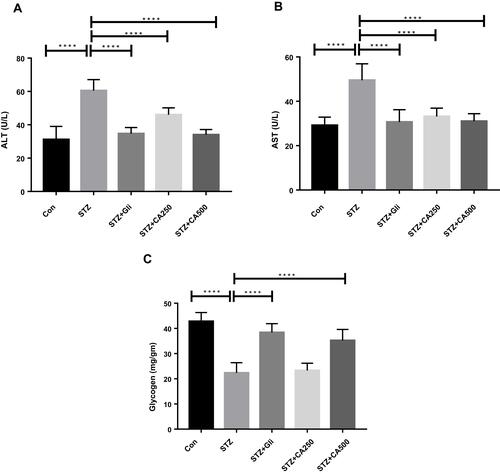
Figure 5 Effectiveness of CA leaves extract on kidney functions (A) serum creatinine and (B) BUN. Data are expressed as means ± S.E.M.; ****p ≤ 0.00001 vs control or STZ; **p ≤ 0.001 vs STZ; *p ≤ 0.05 vs STZ -induced diabetic rats (n=6).

Figure 6 Effect of CA on oxidative stress (A) nitric oxide (liver) (B) nitric oxide (kidney) (C) AOPP (liver) (D) AOPP (kidney). Data are expressed as means ± S.E.M.; ****p ≤ 0.00001 vs control or STZ; **p ≤ 0.001 vs STZ; *p ≤ 0.05 vs STZ-induced diabetic rats (n=3-6).
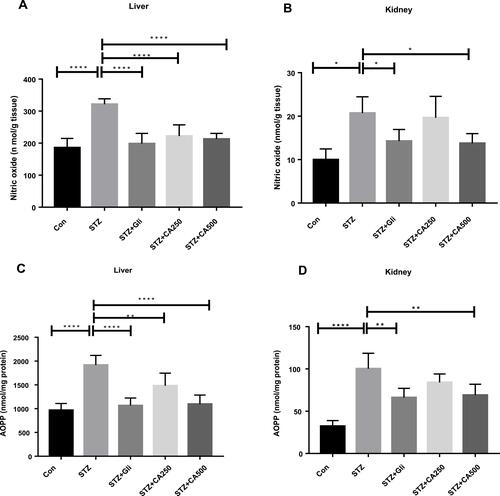
Figure 7 Effect of CA on antioxidant enzymes (A) GSH (liver), (B) GSH (kidney) (C) SOD (liver), (D) SOD (kidney). Data are expressed as means ± S.E.M.; ****p ≤ 0.00001 vs control or STZ; ***p ≤ 0.0001 vs STZ; **p ≤ 0.001 vs STZ; *p ≤ 0.05 vs STZ -induced diabetic rats (n=3-6).
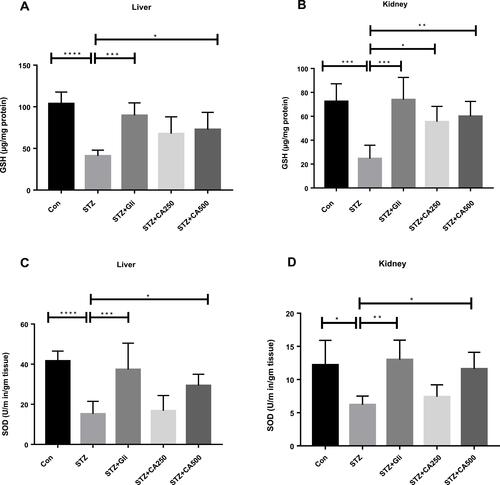
Figure 8 Histological evaluation of liver after treatment with CA. (A) Hepatocytes of control animals. (B) Inflammatory cells infiltration after STZ-induced diabetes. Hepatocytes of animals treated with CA leave extracts (C, D) and glibenclamide (E).
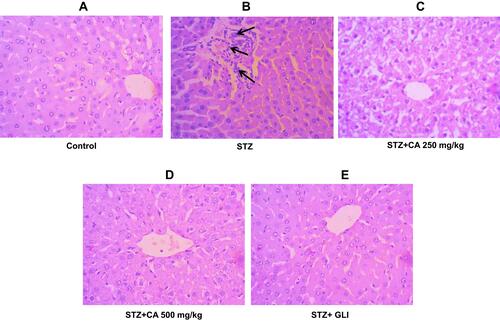
Figure 9 Histological evaluation of diabetic kidney after treatment with CA. (A) Kidney tissues of control animals. (B) sloughing of the cells of the proximal tubules in kidney after STZ-induced diabetes. Architecture of kidney tissues treated with CA leaves extracts (C, D) and glibenclamide (E).
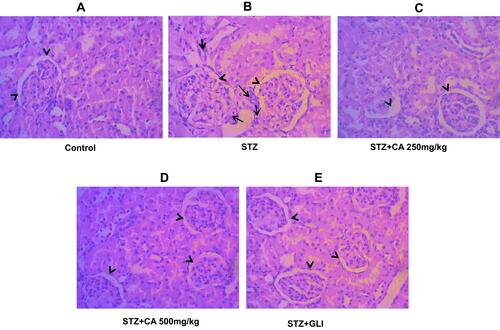
Figure 10 In silico binding of kaempferol, myricetin and rosmarinic acid to molecular targets of diabetes. (A-D) SUR1, (E-H) PPAR-gamma, and (I-L) DPP4 complexes with ligands. Protein secondary structures are shown as depth-cued cartoons (rainbow) and ligands are shown as sticks. The leftmost columns show best docking poses and other columns depict 2-D representations of protein-ligand interactions.
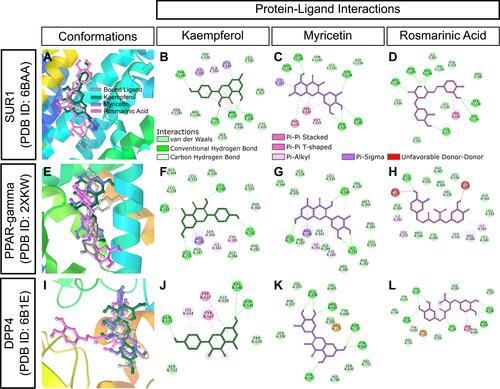
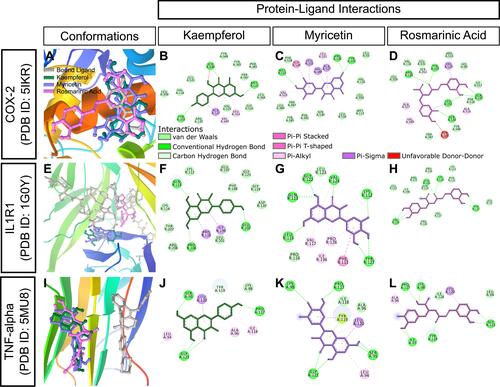
Figure 11 In silico binding of kaempferol, myricetin and rosmarinic acid to molecular targets of inflammation. (A-D) COX-2, (E-H) IL1R1, and (I-L) TNF-alpha complexes with ligands. Protein secondary structures are shown as depth-cued cartoons (rainbow) and ligands are shown as sticks. The leftmost columns show best docking poses and other columns depict 2-D representations of protein-ligand interactions.