Figures & data
Table 1 Primers Used in the Studies
Figure 1 H2 inhibits the progression of OA in the mouse DMM model. The digital X-ray images of mouse knee joints. (A) The white arrow indicates the narrowing of the joint space; the black arrow implies the calcification of the cartilage surface. Typical Safranin O staining of the cartilage and subchondral cortical bone (n = 15, scale bar: 200 µm and 50 µm) (B). Synovitis scores. H2 reduced synovitis scores compared to DMM. (n = 15) (C). Diagrams indicate the cartilage OARIS scores (n = 15) (D). All data are presented as mean ±SEM. ###P < 0.001 vs the sham group; ***P < 0.001 vs the DMM group; n = 15.
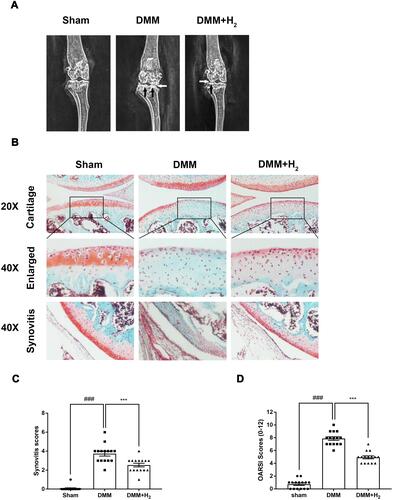
Figure 2 H2 suppresses the apoptosis of cartilage in OA mice. TUNEL staining assay in the mouse cartilage (n = 15) (A and B). Immunohistochemistry of cleaved caspase-3 and P-JNK identified the effect of H2 on the degradation of cartilage matrix in OA mice (n = 15) (C). Quantification of cleaved caspase-3 and P-JNK-positive cells in the cartilage samples (D and E). All data are presented as mean ±SEM. ###P < 0.001 vs the sham group; ***P < 0.001 vs the DMM group; n = 15.
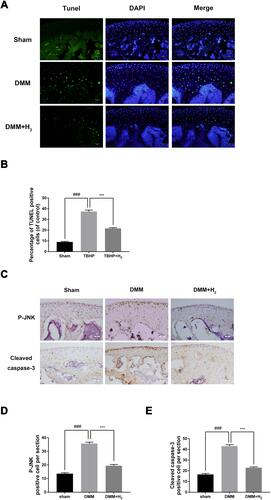
Figure 3 Effect of H2 on human chondrocyte viability. Chondrocytes were stained by toluidine blue, and proteoglycans in chondrocytes were stained purple (n = 3) (A). Safranin O staining of human primary chondrocytes (n = 3) (B). Collagen II immunofluorescence staining of human primary chondrocytes (n = 3) (C). The cytotoxicity and the cell viability of H2 on the TBHP-induced chondrocytes by using the CCK-8 assay (n = 3, 24 h) (D and E). All data are presented as mean ±SEM. *P < 0.05, **P < 0.01, ***P < 0.001, vs the control group, n = 3.
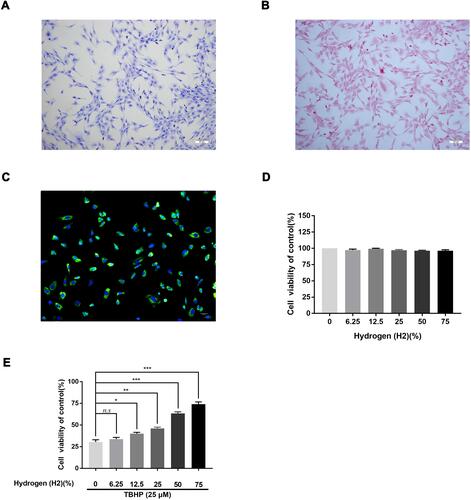
Figure 4 Effects of H2 on TBHP-induced apoptosis in human chondrocytes. The protein expression of cleaved caspase-3 in chondrocytes treated with/without TBHP was detected by Western blotting and TUNEL assay (A–D). H2 exerts the anti-apoptosis effect in TBHP-induced chondrocytes as seen from the TUNEL assay (scale bar: 50 µm) and the quantification of apoptotic positive cells (E and F). The activity of caspase-3 was determined using the caspase colorimetric assay kit (n = 3) (G). All data are presented as mean ±SEM. ###P < 0.001 vs the control group; ***P < 0.001 vs the TBHP group; n = 3.
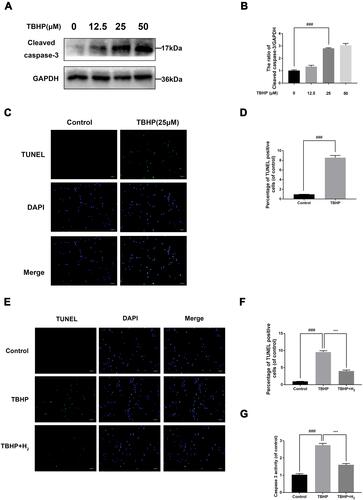
Figure 5 Effects of H2 on the TBHP-induced expression of cytokines and apoptosis-related proteins in human chondrocytes. The levels of cleaved caspase-3, Bcl-2, cytochrome c, and Bax were evaluated by Western blotting (A–E). The mRNA expression levels of Bcl-2 and Bax were assessed by qRT-PCR (F and G). Immunofluorescence of cleaved caspase-3 was observed with a fluorescence microscope (OLYMPUS)(Scale bar: 50 µm) and assayed by Image J (H). All data are presented as mean ±SEM. ##P < 0.01, ###P < 0.001, vs the control group; **P < 0.01, ***P < 0.001, vs the TBHP group; n = 3.
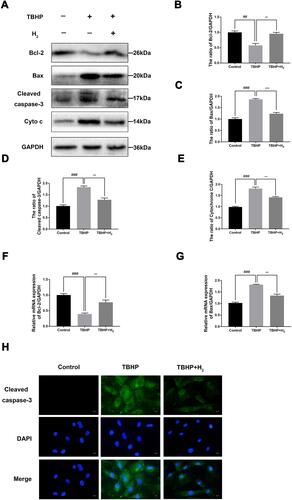
Figure 6 Effects of H2 on influencing ECM synthesis on TBHP-induced chondrocytes. The levels of aggrecan, ADAMTS5, Collagen II, and MMP13 were evaluated by Western blotting (A–E). A representative image of immunofluorescence staining of collagen II in the chondrocytes was detected by a fluorescence microscope (OLYMPUS) (Scale bar: 50 µm) and assayed by the Image J software (F and G). All data are presented as mean ±SEM. ##P < 0.01, ###P < 0.001, vs the control group; *P < 0.05, **P < 0.01, ***P < 0.001, vs the TBHP group; n = 3.
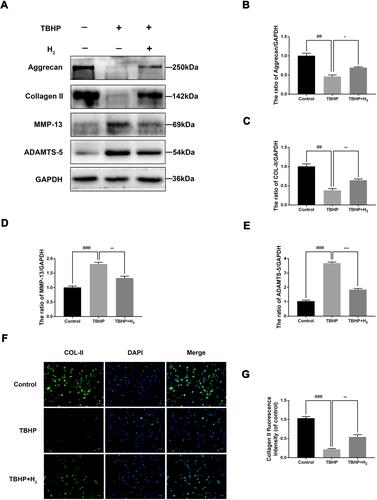
Figure 7 H2 inhibits the TBHP–induced JNK signaling pathway in the chondrocytes. The levels of JNK, P-JNK, Collagen II, MMP-13, cytochrome c, and cleaved caspase-3 in the human chondrocytes were assayed by Western blotting (A–J). The results of the TUNEL assay of the above-treated chondrocytes (scale bar: 50 µm) (K) and the quantification of apoptotic positive cells (L). All data are presented as mean ±SEM. ##P < 0.01, ###P < 0.001 vs the control group; *P < 0.05, **P < 0.01, and ***P < 0.001, vs the TBHP group; &P < 0.05, &&P < 0.01, and &&&P < 0.001 vs the TBHP + H2 group; n = 3.
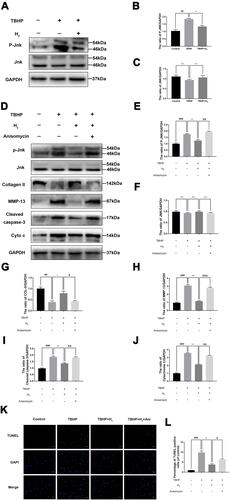
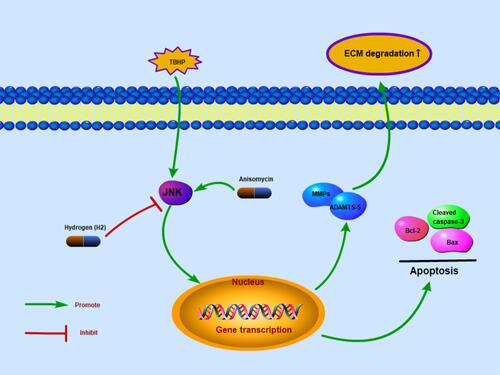
Figure 8 Schematic reveals the involvement of H2 via the JNK pathway and the potential protective effects in the progression of osteoarthritis.